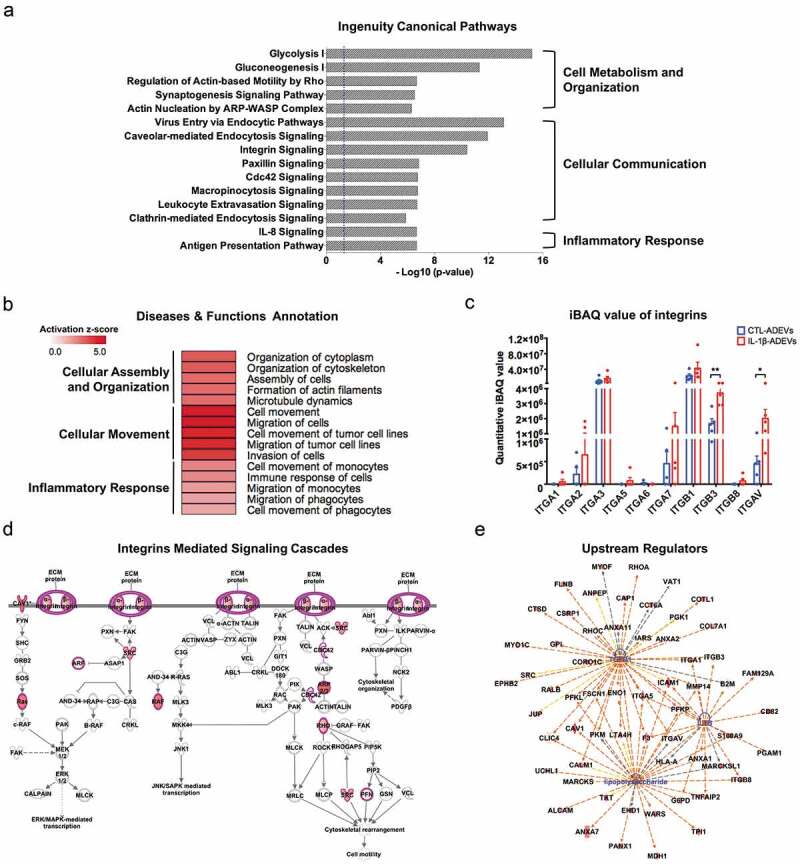
Figure 4.

Ingenuity pathway analysis (IPA) of differentially expressed proteins (DEPs) in IL-1β- versus CTL-ADEVs. (a) Total 147 DEPs and their expression values were used as input for IPA. Curated list of the 15 most significantly enriched canonical pathways: cell metabolism and organization, cellular communication and inflammatory response. A statistically significant p-value of 0.05 is indicated on the plot as a vertical dashed line, at the x-value of 1.30. (b) Heatmap of result from diseases and functions annotation performed by IPA, which are associated with cellular assembly and organization, cellular movement and inflammatory response. (c) The iBAQ value of integrins between CTL- and IL-1β-ADEVs. Data are presented as mean ± SEM of n = 5 for both groups. *p < 0.05, **p < 0.01 compared to control group as determined by paired Student’s t-test. (d) DEPs in IL-1β-ADEVs mapping to the integrin-mediated signal cascades conducted by IPA. The highlighted proteins indicate the activated regulation. (e) Consistence of DEPs in IL-1β-ADEVs with the increased signalling of potential upstream regulators including TGF-β1, LPS and IL-1β. Blue colour indicates the upstream regulators; red colour scales the up-regulation of proteins in IL-1β-ADEVs; Red and orange lines indicate leading to activation by predicted relationships.
