Figure 7.

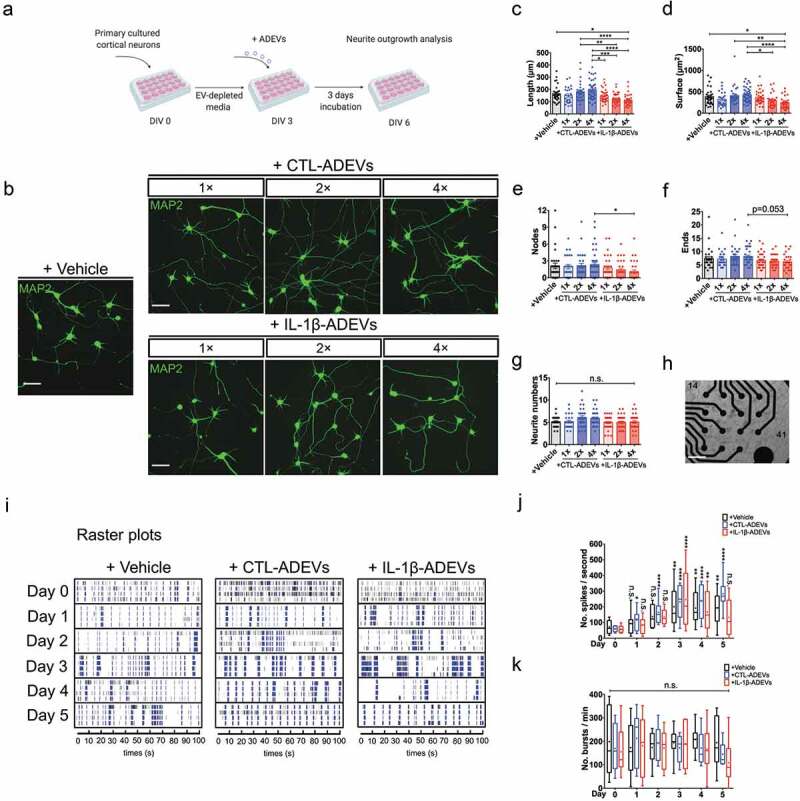
IL-1β-ADEVs exert suppressive effects on neurite outgrowth and neural spike firing. (a) The scheme of ADEV’s effects on neurite outgrowth. Different doses of purified CTL-ADEVs and IL-1β-ADEVs were added to primary cultured mouse cortical neurons at DIV 3 and incubated for three days. Neurite outgrowth analysis was performed at DIV 6 using Neurolucida imaging software. (b) Representative fluorescent images of MAP2+ cortical neurons after three-day exposure to the indicated concentrations of CTL- and IL-1β-ADEVs (1×, 1.25 μg/mL; 2×, 2.5 μg/mL; 4×, 5 μg/mL). Control group was treated with vehicle instead of ADEVs. Scale bar, 50 μm. Quantification of neurite outgrowth show (c) neurite length, (d) surface area, (e) number of nodes, (f) number of neurite ends, and (g) total neurite number for the indicated concentrations of ADEVs. Data are present as mean ± SEM from three independent experiments. n.s., no significance; *p < 0.05, **p < 0.01, ***p < 0.001, ****p < 0.0001 as determined by ordinary one-way ANOVA with Tukey’s multiple corrections (c, d) and non-parametric test with Dunn’s multiple corrections (e–g). (h) Multi-electrode array (MEA) for monitoring neural spike firing after treating primary neurons with CTL- and IL-1β-ADEVs from DIV 17. Phase-contrast image of primary neurons cultured on an MEA plate at DIV 17. Scale bar, 500 μm. (i) Representative raster plots show the spontaneous firing activities recorded from primary neurons after incubation with ADEVs during a five-day time course. Quantitation of (j) the number of spikes per second (k) and the number of bursts per min from primary neurons incubated with vehicle, CTL- or IL-1β-ADEVs during day 0 to 5. Data were collected from 8 MEAs (2 replicates × 4 independent experiments). Box and whisker plots are used to show the median and the 5th to 95th percentiles; Plus sign indicates the means. n.s., no significance; *p < 0.05, **p < 0.01, ****p < 0.0001 compared to day 0, respectively, as determined by repeated measure two-way ANOVA with Sidak’s multiple corrections.
