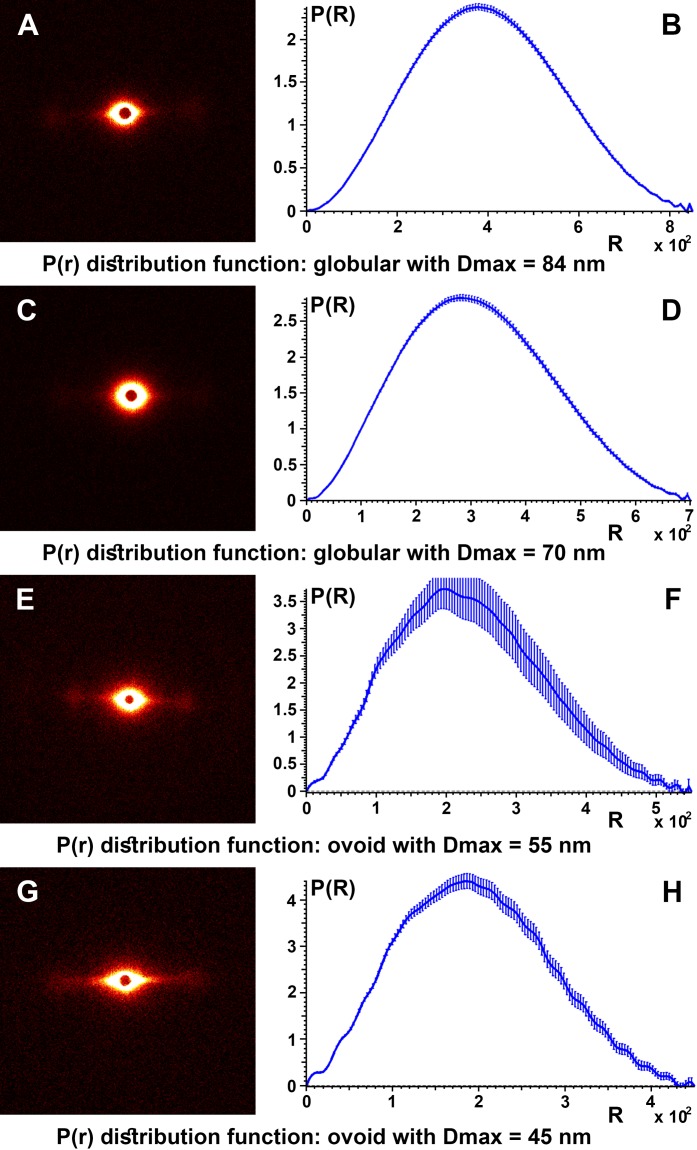
Figure 6. SAXS diffractogram and P(r) distribution function.
SAXS diffractogram and P(r) distribution function: (A and B) Black hair from healthy donor (B-Control). (C and D) Grey hair from healthy donor (G-Control). (E and F) Unaffected black hair of patient with AA (B-AA). (G and H) Non-pigmented hair of patient with AA (W-AA).

