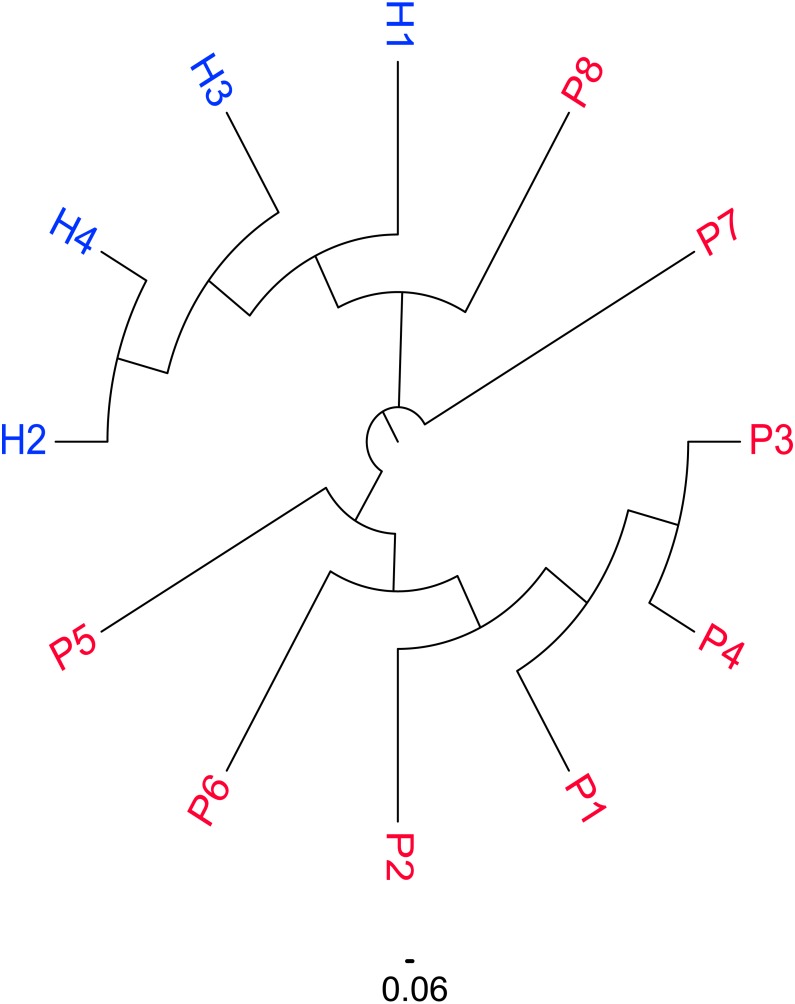
Figure 2. Similarity distribution of CDR3 sequences in the SSc and Control groups.
Similarity distribution of CDR3 sequences in the SSc and Control groups by calculating the Jaccard distance between each pair of samples. The subjects were divided into three groups according to the figure: female patients with SSc (P1–6), male patients with SSc (P7–P8) and healthy controls (H1–4).

