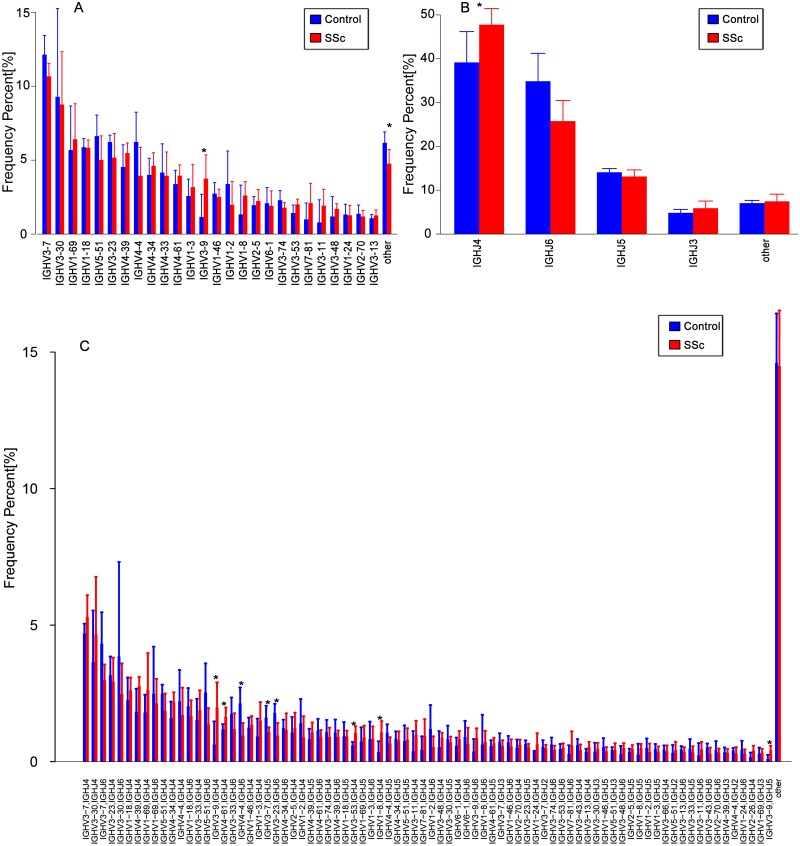
Figure 3. Relative frequencies of each IGHV gene.
Relative frequencies of each IGHV gene (A) [IGH V3-9: P = 0.032 ], IGHJ gene; (B) [IGHJ4: P = 0.028] and IGH V-J; (C) [IGHV3-9-J4: P = 0.041; IGHV3-9-J5: P = 0.023; IGHV4-4-J6: P = 0.016; IGHV3-7-J5: P = 0.045; IGHV3-23-J6: P = 0.016; IGHV3-53-J4: P = 0.016;IGHV1-8-J4: P = 0.016] fragments in PBMCs from the SSc and Control groups. The bars and error bars indicate the mean frequencies and standard deviations of the results from individual subjects. Differences were statistically analyzed for significance by the Wilcoxon rank sum test (*P < 0.05).

