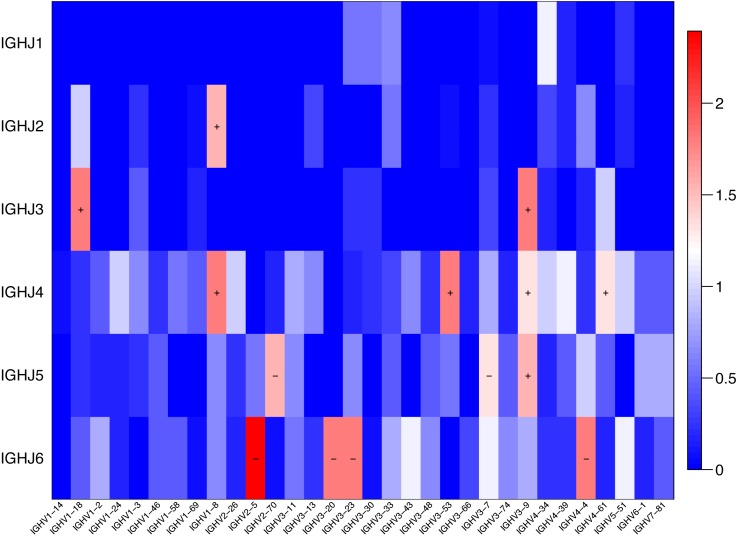
Figure 4. Comparison of the average V-J gene utilization of the sequenced IGH sequences between the SSc group and Control group.
Comparison of the average V-J gene utilization of the sequenced IGH sequences between the SSc group and the Control group. The J gene segments are arranged on the y-axis, and the V gene segments are arranged on the x-axis. The different colors (red to blue rectangular bands) indicate the different levels of significance. Rectangular bands is the value converted from −log10 (p value), “+” indicates significant difference (SSc group is higher than the Control group), and “−” indicates significant difference (Control group is higher than SSc). Differences were statistically analyzed for significance by the Wilcoxon rank sum test (p < 0.05).

