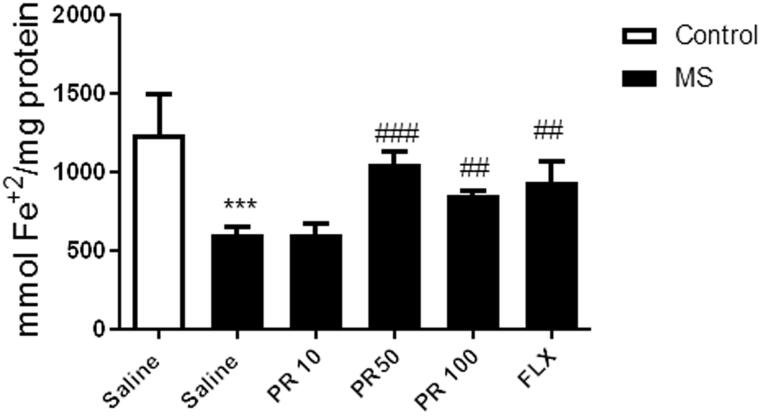
Figure 3.
Effects of MS and progestrone on total antioxidant capacity in the hippocampus. Values are presented as mean ± S.E.M from six samples and were analysed using one-way ANOVA followed by Tukey post hoc test. ***p < 0.001 compared to the control group, ##p < 0.01 and ###p < 0.001 compared with the saline-received MS mice.

