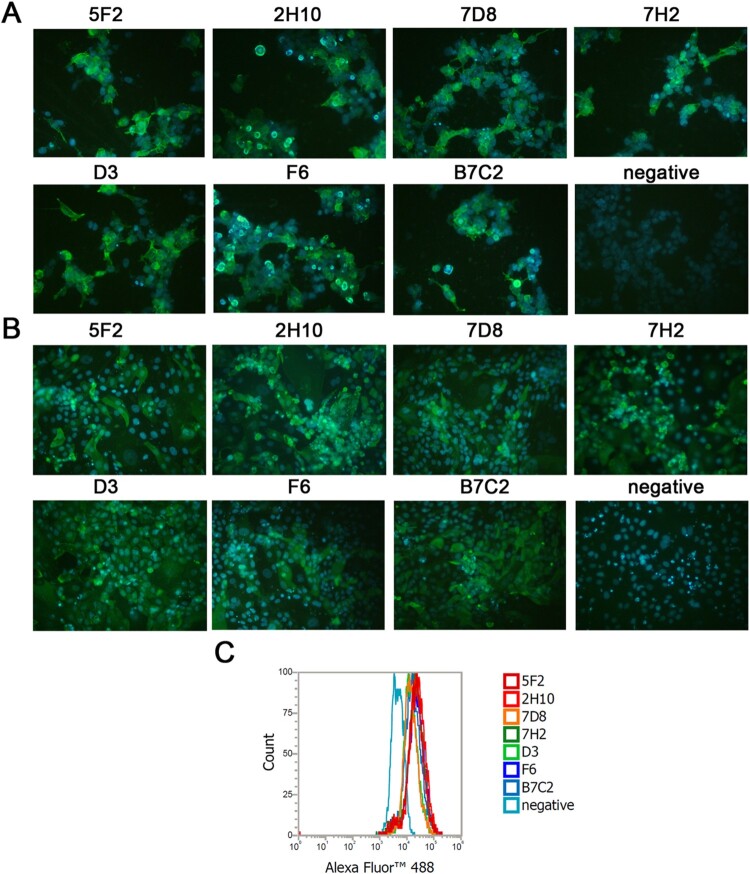
Figure 1.
Characterization of N9 mAbs in IFAs and FCM analysis. (A) 293 T cells were transfected with NA plasmids expressing NA of H7N9 SH/2/13 virus. (B) MDCK cells were infected with H7N9 SH/2/13 virus. (C) The representative graph of MDCK cells infected with SH/2/2013 virus. Bound antibodies were detected by Alexa Fluor™ 488-conjugated anti-mouse antibody. An isotype-matched IgG (IgG2a) was used as a negative control. Nuclei were stained with DAPI (blue).

