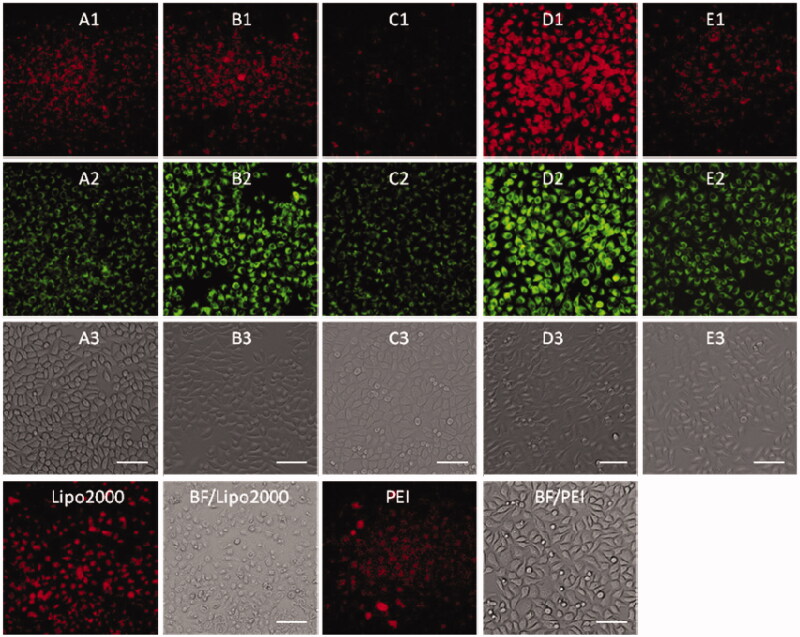
Figure 9.
Fluorescence microscope images of HepG2 cells transfected with Cy5-labeled DNA (9 μg/mL) by MFCs 1a–1e at the concentration of 20 μM, 25 kD PEI and lipofectamiine 2000 as positive control. (A1–E1) red channels, (A2–E2) green channels, (A3–E3) bright field images. The scale bar in the figure is 50 μm.

