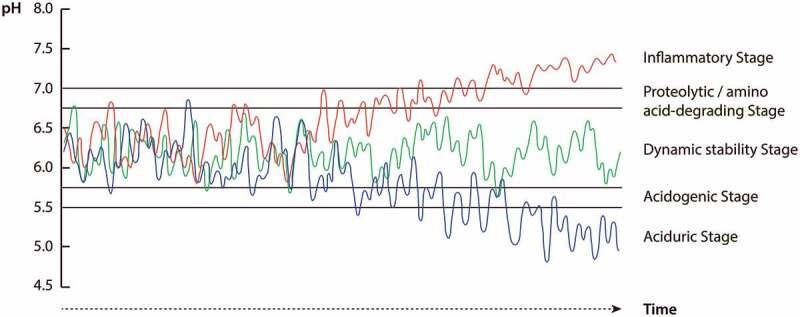
Figure 1.

Illustration of three theoretical pH response patterns in the integrated hypothesis of dental caries and periodontal diseases. The green curve illustrates pH fluctuations of the microbiota at the dynamic stability stage associated with clinical health, at which pH fluctuations are balanced over time due to infrequent nutrient exposures. The red and blue curves show pH fluctuations of the microbiota at subgingival and supragingival sites in response to increasing exposure microbial nutrients, respectively. When GCF/inflammatory nutrients are intense and prolonged, pH of the microbiota may drift from the dynamic stability stage into proteolytic/amino-acid degrading and inflammatory stages associated with gingivitis and periodontitis (red curve), whereas intense and prolonged increases in exposure to dietary carbohydrates promotes a drift of pH into acidogenic and aciduric stages associated with caries (blue curve). For further details, see text
