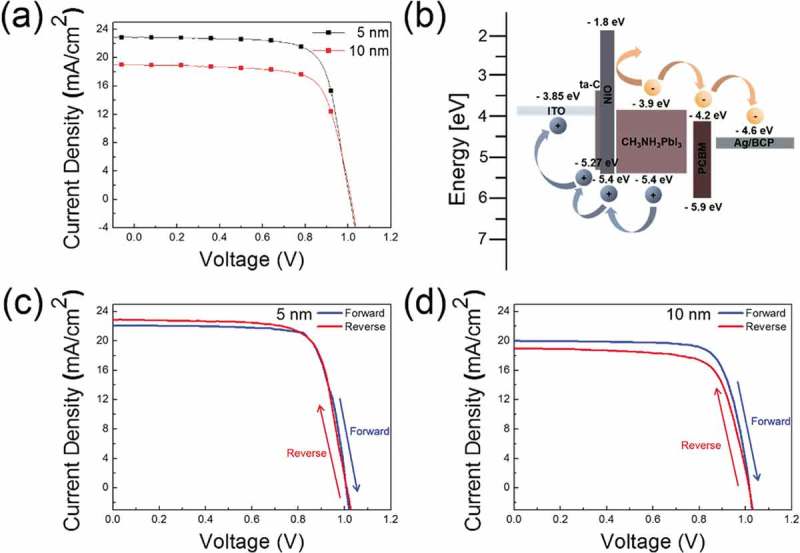
Figure 8.

(a) Current density–voltage (J-V) curves of PSCs fabricated on the double HTL of ta-C (5, 10 nm) and NiO. (b) Energy band diagram of the PSCs with double HTL of ta-C and NiO. Current density–voltage (J-V) curves for forward and reverse scans (74 mV/s) of solar cells with ta-C and NiO double HTL; (c) ta-C 5 nm, (d) ta-C 10 nm.
