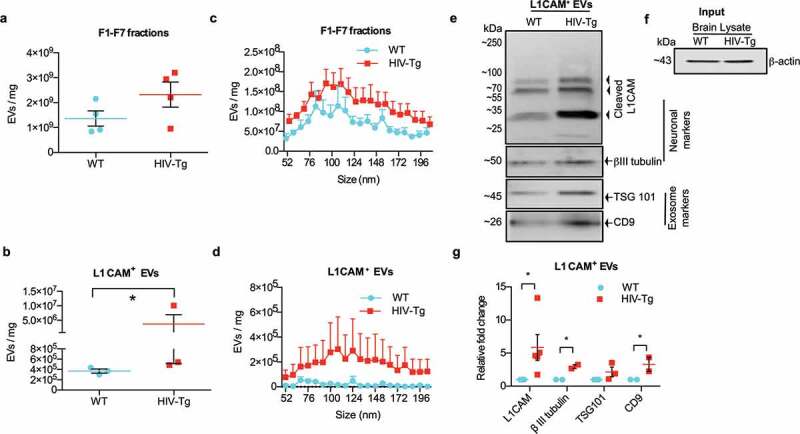
Figure 2.

Neuronal-derived EVs are enriched in the brain of HIV-1 transgenic rats. (a) Graph showing the concentration of pooled F1-F7 fractions obtained from the brains of WT and HIV-Tg rats (n = 4), as evaluated by zeta-view. Equal amounts of brains from WT and HIV-1 Tg rats were used as the starting material to isolate total EVs. All conditions and dilutions were kept identical in both the groups (Wt and HIV-1 Tg) for further isolation of F1-F7 EVs and for L1CAM+ EVs. * p < 0.05 by unpaired parametric student’s t-test with Welch’s correction. (b) Graph shows the actual concentration of EVs in the L1CAM+ EVs fractions obtained by immunoprecipitation of pooled F1-F7 fractions of WT and HIV-1 Tg rats (n = 3), evaluated by zeta view. (c) Size distribution of F1-F7 fractions, and (d) L1CAM+EVs was examined by nano track analysis using zeta view. Figures depict the actual concentration of EVs by adjusting for the dilution factor in the range of 50–200 nm. (e) Western blot images showing increased expression of neuronal markers (L1CAM, βIII tubulin) in L1CAM+ EVs from HIV-1 Tg rat compared to L1CAM+ EVs from WT rat (n = 5 each group). L1CAM+ EVs derived from the brains (equal weights) from each group were loaded onto the gel. Representative L1CAM+ EVs from one WT and one HIV-1 Tg rat are shown. CD9, TSG101 were used as a positive control for exosomes. (f) Brain lysate was used as input (1% of total brain lysate) and β-actin from brain lysates (input) was used as endogenous control for the brain-derived EVs. (g) Densitometry of proteins in L1CAM+EVs fractions of WT and HIV-1 Tg rats normalized with brain lysate β actin (input). Graph for L1CAM expression shows densitometry of ~55 kDa band. *p < 0.05 by multiple t-test using the Holm-Sidak method.
