Fig. 6.
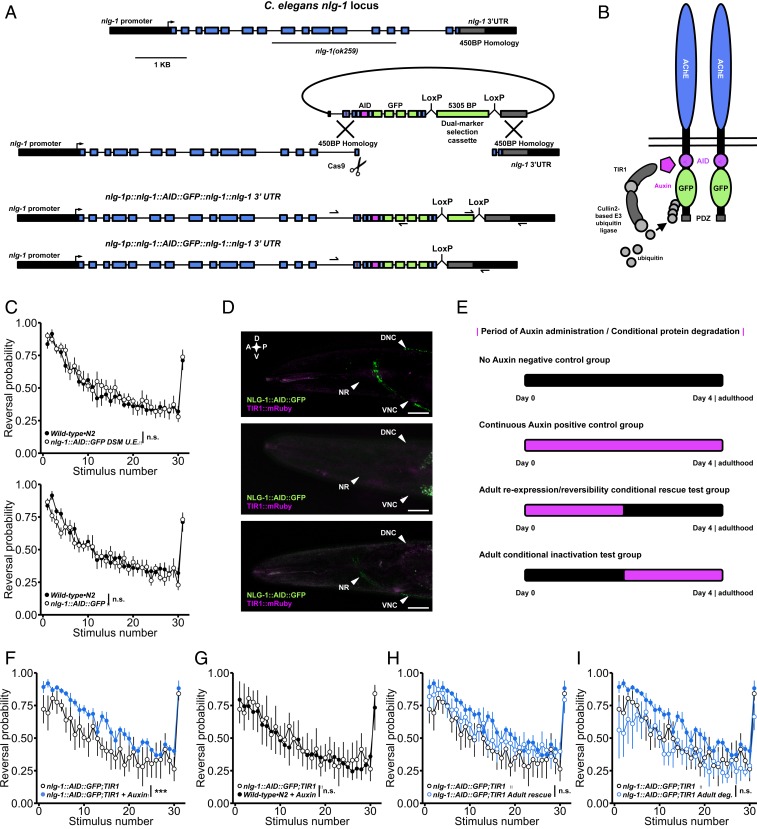
CRISPR-Cas9 auxin-inducible degradation reveals phenotypes caused by developmental loss of neuroligin can be rescued by adult reexpression. (A) The modified DMS cassette genome editing strategy used to insert GFP and a short degron tag into the endogenous neuroligin locus. The maroon line in the repair template indicates the location of an engineered silent mutation in the protospacer adjacent motif to prevent cleavage of exogenous DNA. (B) Schematic of the NLG-1::AID::GFP transgene. In the presence of auxin, TIR1 is activated targeting the fusion protein for degradation. Following auxin treatment, TIR1 is inactivated, allowing conditional degradation and reexpression of the fusion protein. (C) The fusion protein is fully functional; NLG-1::AID::GFP animals did not display habituation impairments before (Top) or after (Bottom) DMS cassette excision. (D) The fusion protein localizes properly to synapses in the nerve ring and nerve cords (Top). Treatment with 0.025 mM auxin is sufficient for complete degradation of the fusion protein (Middle) that is reversible 48 h after removal from auxin (Bottom). A, anterior; P, posterior; D, dorsal; V, ventral; NR, nerve ring. (Scale bar: 0.02 mm.) (E) Period of auxin administration for each group. (F) Continuous auxin administration recapitulated impairments in habituation of response probability. (G) Wild-type•N2 animals continuously treated with auxin exhibited normal habituation. (H) Adult-specific reexpression of neuroligin partially rescued impaired habituation. Solid blue circles represent continuous auxin administration group (as in F). (I) Adult-specific degradation of neuroligin did not induce habituation impairments (solid blue circles as in F). (C, F, and I) Binomial logistic regression followed by Tukey’s HSD criterion was used to determine significance of the habituated level (proportion reversing at tap 30) for each pair of strains (***P < 0.001). n.s., not significant. Data shown as mean ± SEM using plates as n.

