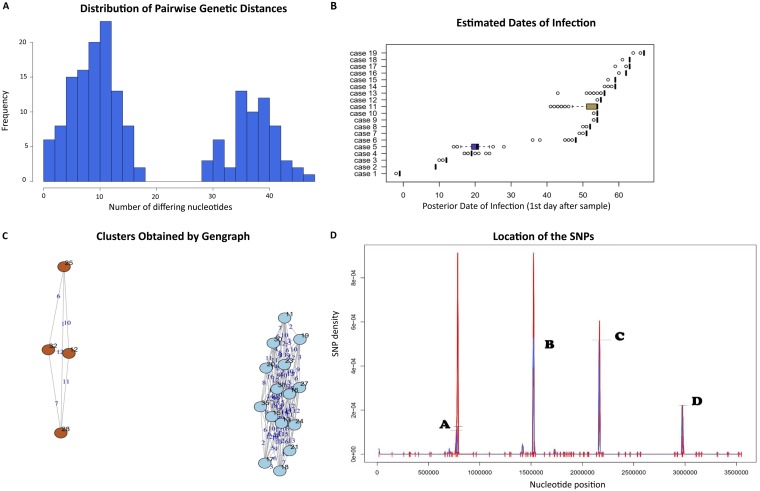
FIG 4.
Bayesian transmission network analysis of the pMAL-1-mediated clone. (A) Histogram showing the distribution of pairwise genetic distances of the isolates and the relative frequencies of the genetic distances of the isolates of the pMAL-1-mediated clone. (B) Box-and-whisker plots of the estimated dates of infection. The cases are arranged based on how ancestral their core genomes are. (C) Isolates of the pMAL-1-mediated clone and their relative SNP distances from the other isolates of the cluster. At a hamming distance of 20, the isolates were arranged into two apparent subclones based on SNPs shared by some isolates in their core genomes introduced during the progression of the outbreak. (D) Graph showing the density of the SNPs relative to their positions in the genomes of the sequenced isolates: A (bp 784121), BapA prefix-like domain-containing protein; B (bp 1521949), DUF2750 domain-containing protein FDN01_10955; C (bp 2162660), stress-induced protein; D (bp 2971361), putative pilus assembly protein FilE.

