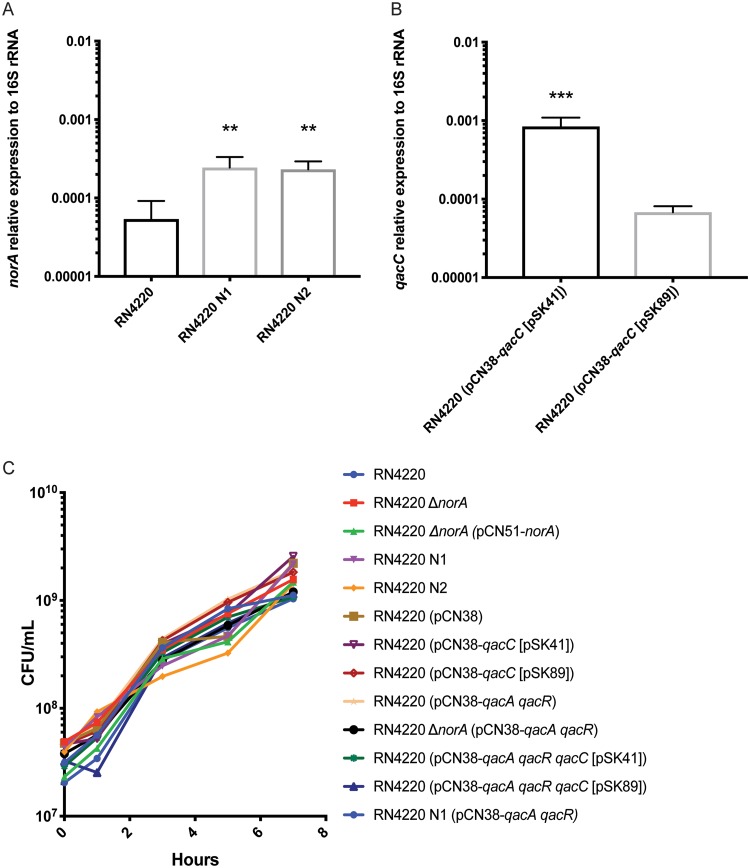
FIG 1.
Isogenic strain characterization. (A) The expression of norA relative to that of the 16S rRNA gene was examined in the isogenic strains RN4220, RN4220 N1, and RN4220 N2. Bar graphs indicate the geometric means from 3 biologically independent replicates, and error bars represent the geometric SD. A statistically significant difference from RN4220 (P < 0.01) is indicated by double asterisks. Statistical analysis was conducted by one-way analysis of variance (ANOVA) with Tukey’s correction for multiple comparisons. (B) The expression of qacC relative to that of the 16S rRNA gene was examined in the isogenic strains RN4220 (pCN38-qacC [pSK41]) and RN4220 (pCN38-qacC [pSK89]). A statistically significant difference between strains (P < 0.001) is indicated by triple asterisks. Statistical analysis was conducted using a Student t test. Bar graphs indicate the geometric means from 3 biologically independent replicates, and error bars represent the geometric SD. (C) Growth curve of isogenic strains. Overnight cultures were subcultured and strains were grown for 7 h. CFU were determined at 0, 1, 3, 5, and 7 h. The geometric means from at least 2 biologically independent replicates are plotted.

