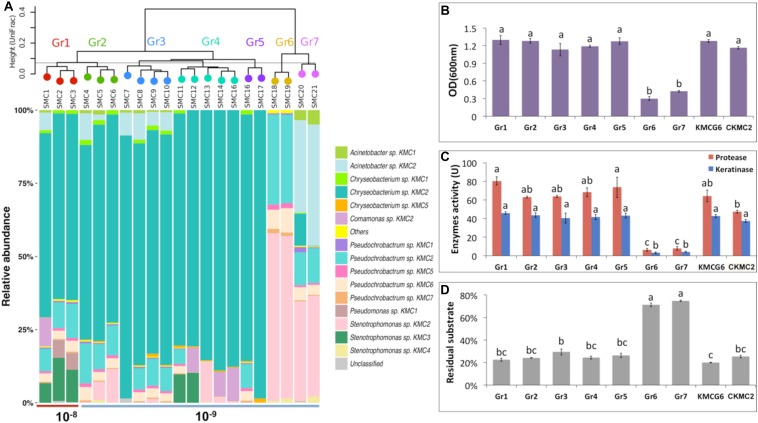
FIGURE 4.
Integrated comparison of selected SMC. (A) 21 SMC divided into seven groups based on their community similarities from 16S rRNA gene analysis (weighted UniFrac distance). Group 1 (Gr1) includes three simplified microbial consortia SMC1, SMC2, and SMC3 from dilution 10–8. A total of 18 SMC (SMC4 – SMC21) were clustered into six groups (Gr2 – Gr7) from dilution 10–9. (B) Cell density (OD600nm) comparison of group 1–7, KMCG6 and the most abundant species in the initial KMCG6, Chryseobacterium sp. KMC2 (CKMC2). (C) Comparison of enzymes (protease and keratinase) activity. (D) Comparison of the residual substrate ratio. Lowercase letters (e.g., a, b, and c) in (B–D) refer to significant differences between groups with one-way ANOVA followed by post hoc Tukey’s HSD test (p < 0.05).

