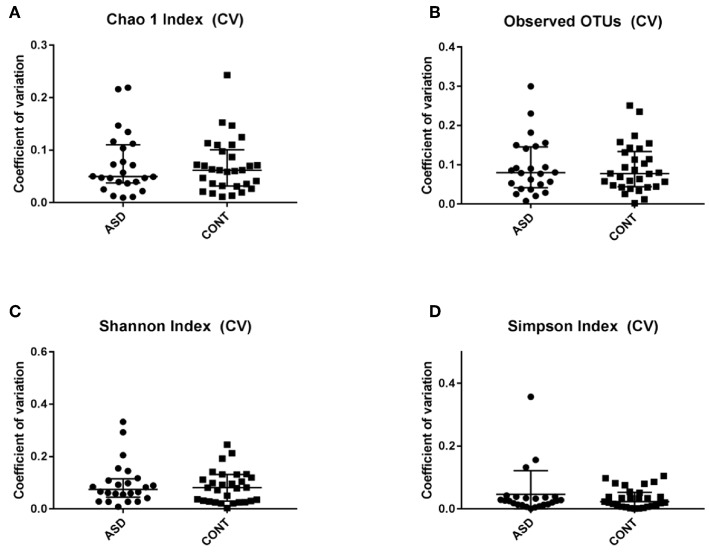
Figure 2.
Temporal variability measured by coefficient of variation (CV) in α-diversity measures. Data expressed as median (IQR). There was not difference between the groups. CV is shown for (A) Chao 1 Index, (B) Observed OTUs, (C) Shannon Index and (D) Simpons Index. CV - Coefficient of variation; ASD - children with Autism spectrum disorder; CONT - control group; Data expressed as mean ± SEM.

