
Figure 2.
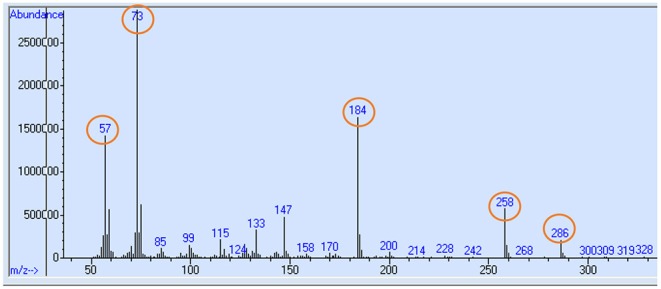
Typical mass chromatogram ion fragmentation pattern of tBDMS-proline produced from plasma or tissue samples in GC MS. Selected ion monitoring for mass to charge ratio (m/z) ratio of 73, 147, 184, 258, and 286 (highlighed in circle) were performed, and ratio of 287–286 was taken to measure the 13C-proline enrichment.