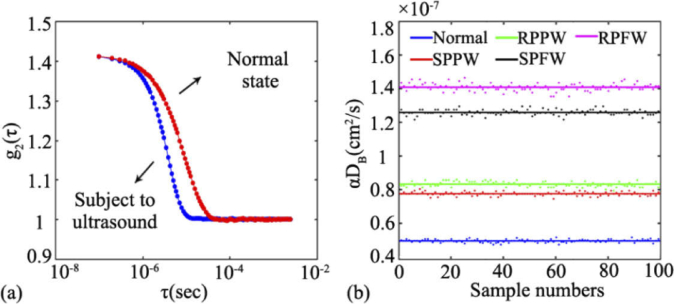
Fig. 9.
(a) The normalized light intensity temporal autocorrelation function (i.e., g2(τ) curve) collected from the liquid phantom, with the ultrasound off (in red) and on (in blue). (b) The BFI values derived from different combinations of acoustic waves, i.e., normal (without ultrasound), SPPW, RPPW, SPFW, RPFW.

