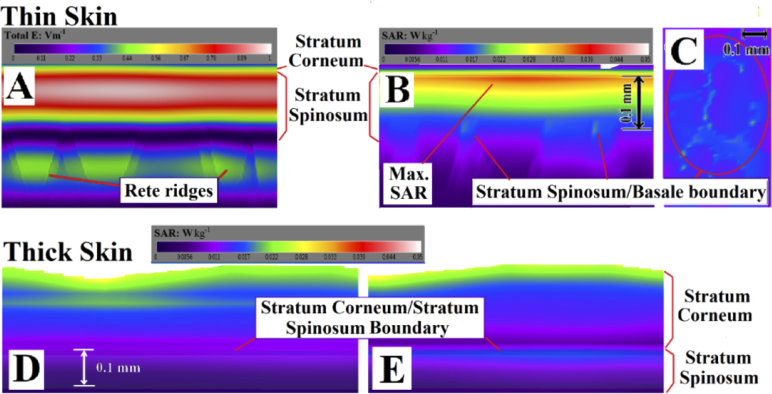
Fig. 3.
(A) Lateral cross section of a typical E-field distribution in thin skin following an excitation of 1.0 Vm-1. The rete ridges are visualized. (B) The thin skin SAR distribution. The maximal SAR is in the upper SS and there are anomalous regions at the SS/SB boundary. (C) Horizontal section of the distribution of SAR at the SS/SB boundary at 0.13 mm below the skin surface, with regions of up to 100% higher absorption compared to the average. (D) Thick skin SAR with an intermediate mode in which the outer two layers are set at 15% hydration and a cascade to 40% hydration just above the SS. The energy is deposited in the upper regions of the dead SC. (E) The “dry” mode of thick skin, with more radiation surviving to the upper regions of the SS.

