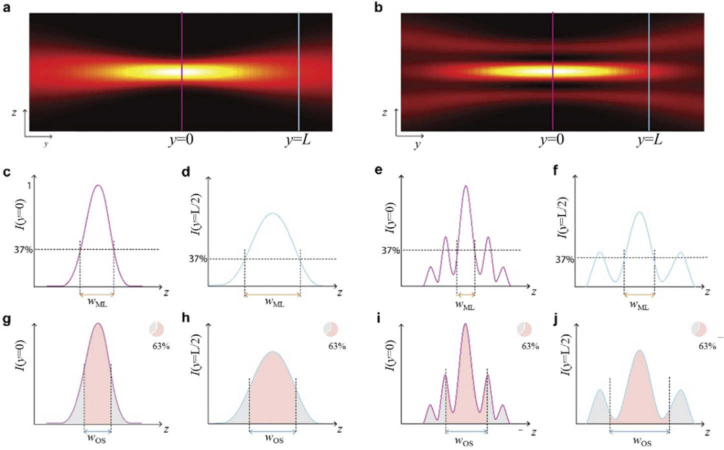
Fig. 2.
Definition of Main Lobe Thickness and Optical Sectioning. yz-cross sections of the intensity of a single-lobe beam (a) and a multi-lobe beam (b) are shown. The respective profiles at the focus (purple line) and at a distance y = L, where the thickness has doubled (blue line) are shown in c-j. c, d and e, f illustrate the main-lobe thickness, defined as the range where the intensity is higher than 37% of the maximum intensity in the focus, in focus (c, e) and at distance y = L (d, f) for single-lobe beam (c, d) and multi-lobe beam, respectively. Sub-figures g-j correspondingly illustrate Optical Sectioning wOS, defined as the range that contains 63% of the beam’s power.

