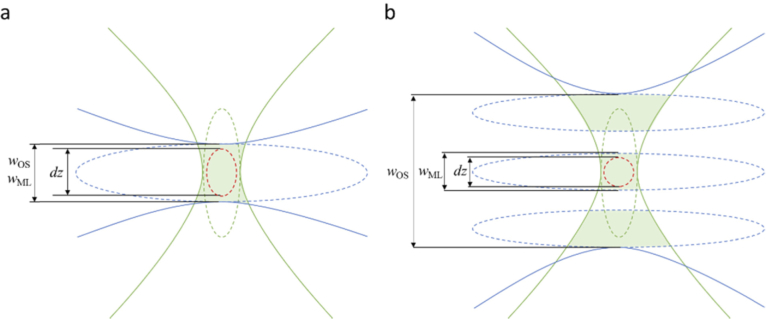
Fig. 3.
Schematic illustration of the effect of different beam shapes on axial resolution dz and optical sectioning OS in a light sheet microscope. The illumination PSF (blue) indicates the intensity of the illumination light. The detection PSF (green) indicates the location-dependent detection probability for fluorescence photons. The dotted lines indicate iso-intensity surfaces, e.g. at 37% of the peak value. The dotted red line indicates the iso-surface of the combined illumination and detection PSF (product of illumination intensity and detection probability). Its extent along the detection axis is proportional to the axial resolution of the system. The green shaded area indicates the volume where fluorophores are illuminated, and fluorescence is collected. The optical sectioning measures the extent of this volume along the detection axis. In a), where a single lobe illumination beam is shown, resolution is anisotropic, i.e. lateral resolution is better than axial resolution, but optical sectioning is close to axial resolution. In b), where a multi-lobe illumination beam is sketched, resolution is isotropic, but additional fluorescence signal is collected from the areas illuminated by the side lobes. Optical sectioning is inferior to axial resolution. The side lobes illuminate out-of-focus planes that blur the resulting image.

