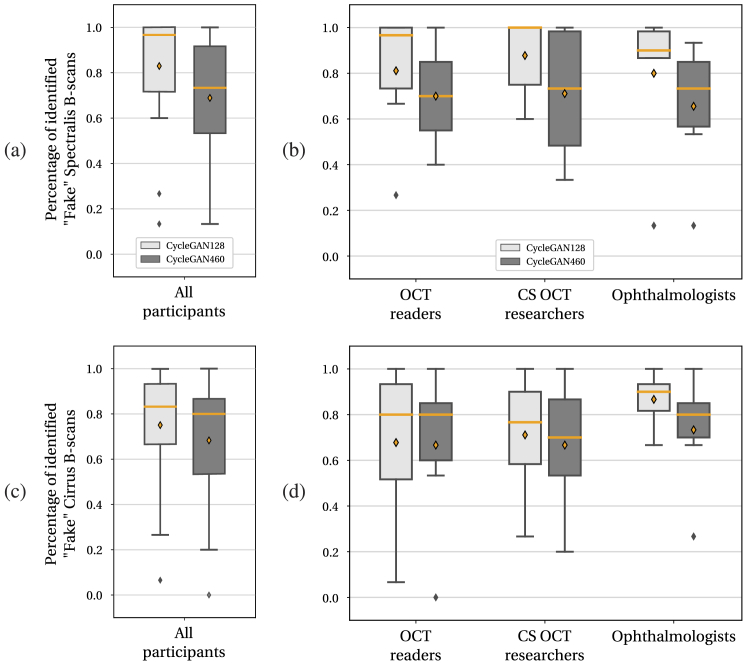
Fig. 9.
Box plots illustrating the amount of correctly identified “fake” B-scans, when showing the original/translated pairs to the participants (OCT readers (), computer scientists (), ophthalmologists ()). The amount of identified “fake” Spectralis B-scans for the Cirrus-To-Spectralis translation is shown in the top row for (a) all participants and (b) stratified by expertise background. The amount of identified “fake” Cirrus B-scans for the Spectralis-To-Cirrus translation is shown in the bottom row for (c) all participants and (d) stratified by expertise background.

