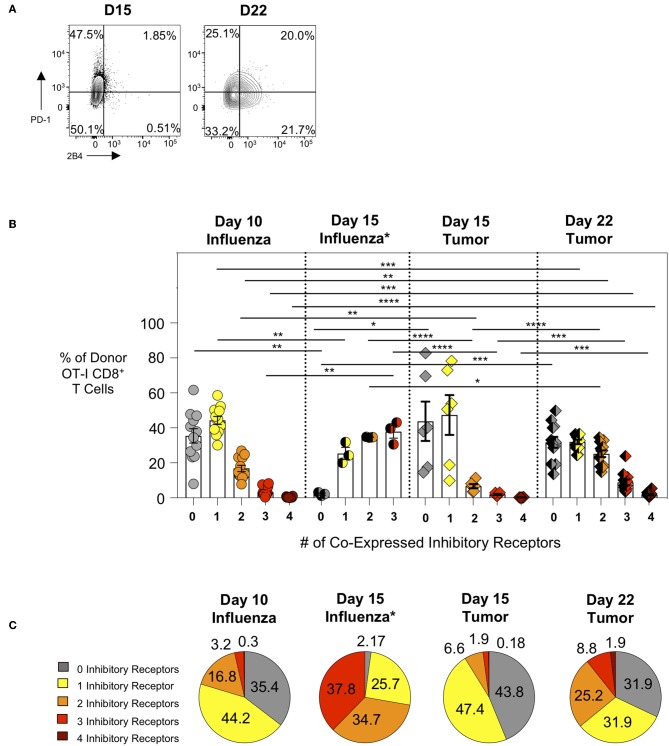
Figure 3.
Intratumoral tumor-specific T cells show upregulated inhibitory receptor co-expression at day 22, but not day 15 post-injection. Activation marker/inhibitory receptor (PD-1, Lag3, 2B4, CD160 for influenza D10, tumor D15 and D22; PD-1, Lag3, and TIM-3 for influenza D15) expression was assessed by ex vivo flow cytometry analysis of donor OT-I CD8+ T cells from the lungs (WSN-OVA influenza) or tumors at the indicated time points. (A) Representative FACS plots showing single or co-expression of PD-1 and 2B4 on donor and endogenous tumor-specific CD8+ T cells from day 15 or day 22 AE17sOVA tumor-bearing mice. (B) Bar graph comparing the frequency of donor OT-I CD8+ T cells expression of 0, 1, 2, 3, or 4 activation markers/inhibitory receptors (PD-1, Lag3, 2B4, CD160) as determined by Boolean gating. (C) Pie charts comparing the overall frequency of inhibitory receptor expression on OT-I CD8+ T cells from the lungs at day 10 post-infection with WSN-OVA or from the tumors at day 15 and day 22 post-injection of tumor cells. FACS analysis was performed using FlowJo v10, and data was imported into SPICE 6.0 for bar graph and pie chart figure production. For experiments (A–C), data is representative of at least two experiments, n = 4 at D10 WSN-OVA influenza virus infection, n = 5 at D15 and n = 12 mice D22 AE17sOVA tumor injection; data is representative of one experiment, n = 3 at D15 WSN-OVA influenza virus infection. For influenza groups at D10, groups 0, 1, and 2 were normally distributed. For influenza groups at D15, all groups were normally distributed. For AE17sOVA groups at D15, groups 0, 1, 2, and 4 were normally distributed. For AE17sOVA groups at D22, groups 0, 1, and 2 were normally distributed. All others were non-normally distributed. When data was normal, a two-tailed unpaired T-test was used to assess significance; when one sample set was non-normally distributed, a two-tailed exact Mann Whitney test was used to assess significance. *p < 0.05; **p < 0.005; ***p = 0.0001; ****p < 0.0001.

