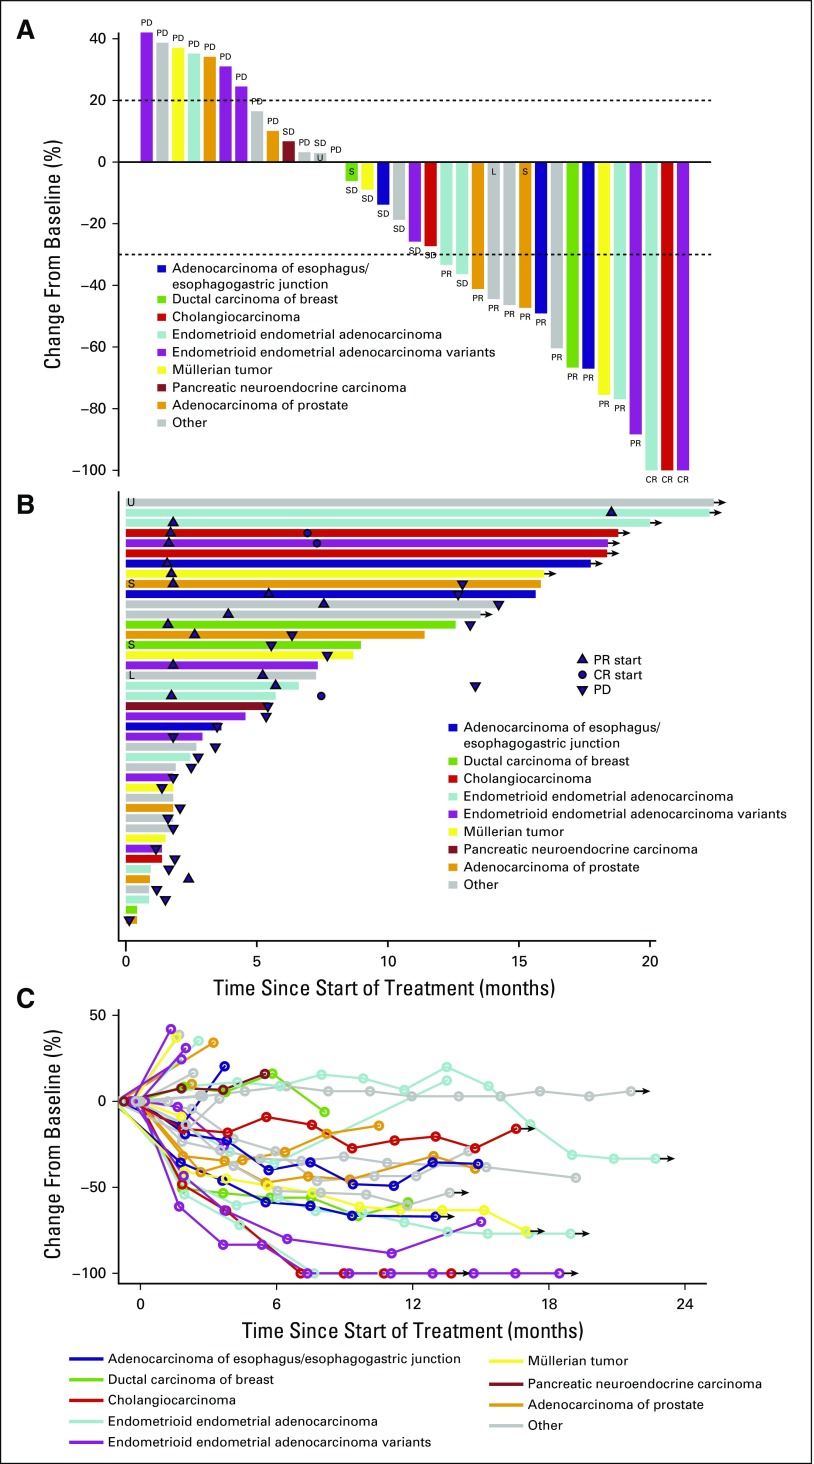
FIG 1.
Clinical responses. (A) Depth of best clinical response by RECIST 1.1 criteria by tumor histology (35 evaluable patients included). (B) Duration of treatment in patients with stable disease (SD) or better, annotated by tumor histology. Arrows represent ongoing therapy at the time of data cutoff. (C) Spider plot of response depth and duration by tumor histology (35 evaluable patients included). Arrows represent ongoing therapy at the time of data cutoff. CR, complete response; L, microsatellite instability low; PD, progressive disease; PR, partial response; S, microsatellite instability stable; U, microsatellite instability unknown.

