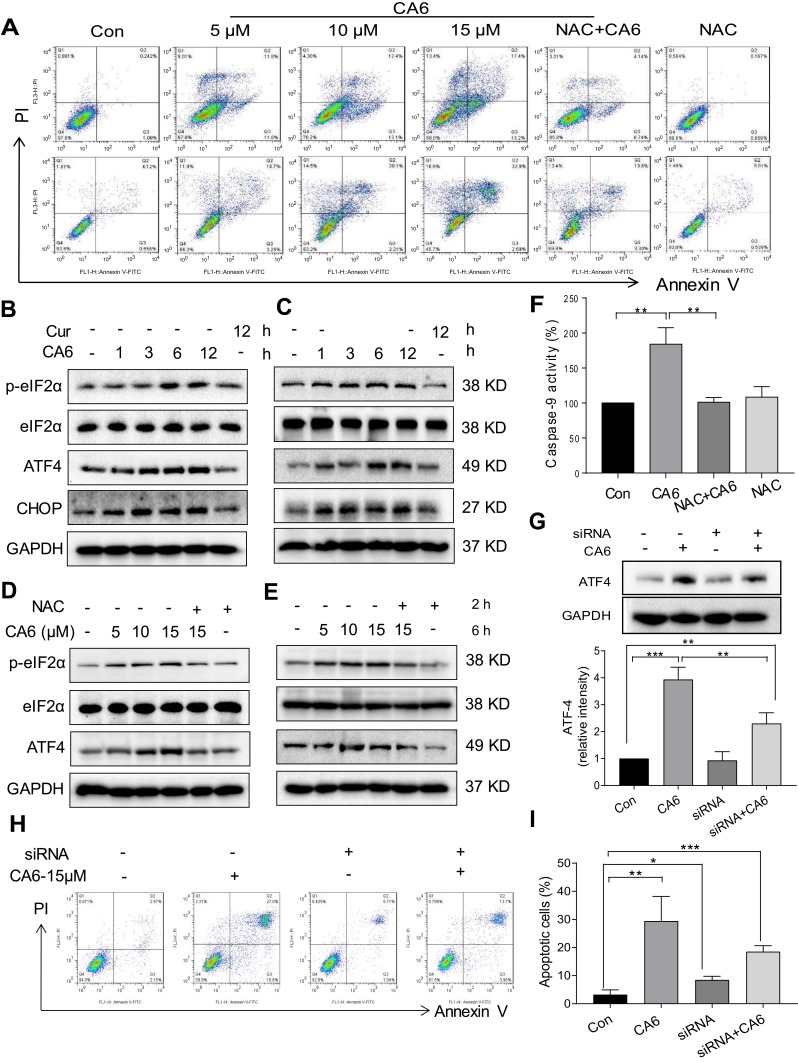
Figure 3.
CA6 induces ER stress and gastric cancer cell apoptosis. (A) BGC-823 and SGC-7901 cells were pretreated with NAC (5 mM) for 2 h before exposure to CA6 for 24 h. Percentage of cell apoptosis was determined by Annexin-V/PI staining. Representative dot plots shown [n = 3]. (B, C) BGC-823 (B) and SGC-7901 (C) cells were challenged with CA6 (15 µM) for indicated time points. Levels of ER stress-related proteins p-eIF2α, ATF4, and CHOP were determined. Curcumin was used as a positive control at the dose of 20 µM. GAPDH was used as the loading control. Representative blots shown. (D, E) BGC-823 (D) and SGC-7901 (E) cells were exposed to CA6 at the dose of 5, 10 and 15 µM for 6 h. Where indicated, NAC pretreatment (5 mM) was carried out for 2 h. Cells treated with curcumin (20 µM) for 12 h were used as the positive control. Protein levels of p-eIF2α, ATF4 and CHOP were determined. (F) BGC-823 cells were transfected with siRNA against ATF4. Cells were then exposed to CA6 (15 μM) for 6 h. Levels of ATF4 were determined. GAPDH was used as loading control. Representative immunoblot (upper panel) and densitometric quantification (lower panel) is shown [Mean ± SEM; n = 3; **P<0.01]. (G) BGC-823 cells were exposed to CA6 (15 μM) for 12 h, with or without pretreatment with NAC (5 mM) for 2 h. The activity of caspase-9 was determined [Mean ± SEM; n = 3; **P<0.01, ***P < 0.001]. (H, I) Flow cytometric analysis of apoptotic cells following knockdown of ATF4 and exposure to CA6. BGC-823 cells transfected with ATF4 siRNA were exposed to CA6 (15 µM) for 24 h. Dot plots (H) and quantification of apoptotic cells (I) are shown [Mean ± SEM; n=3; *P < 0.05, **P < 0.01, ***P < 0.001].

