
Fig 4. Funnel plot of sample size of studies as a function of AKI incidence.
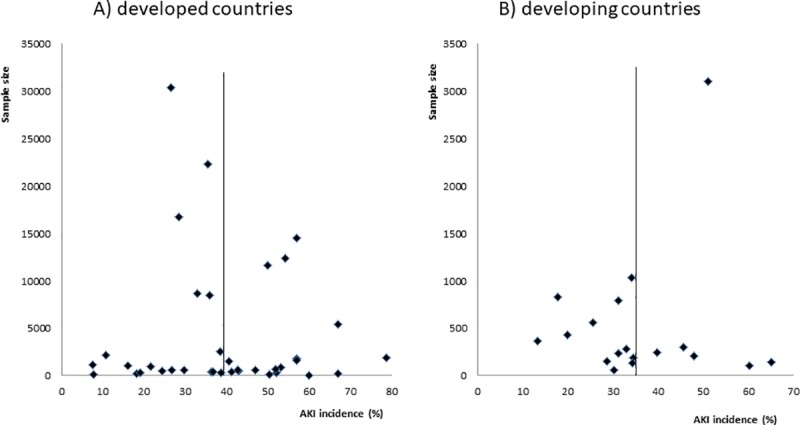
Footnote: The studies shown are those that used the RIFLE, AKIN or KDIGO criteria for AKI definition. A) Developed country studies; B) Developing country studies. Pooled AKI incidence is depicted as a vertical line.