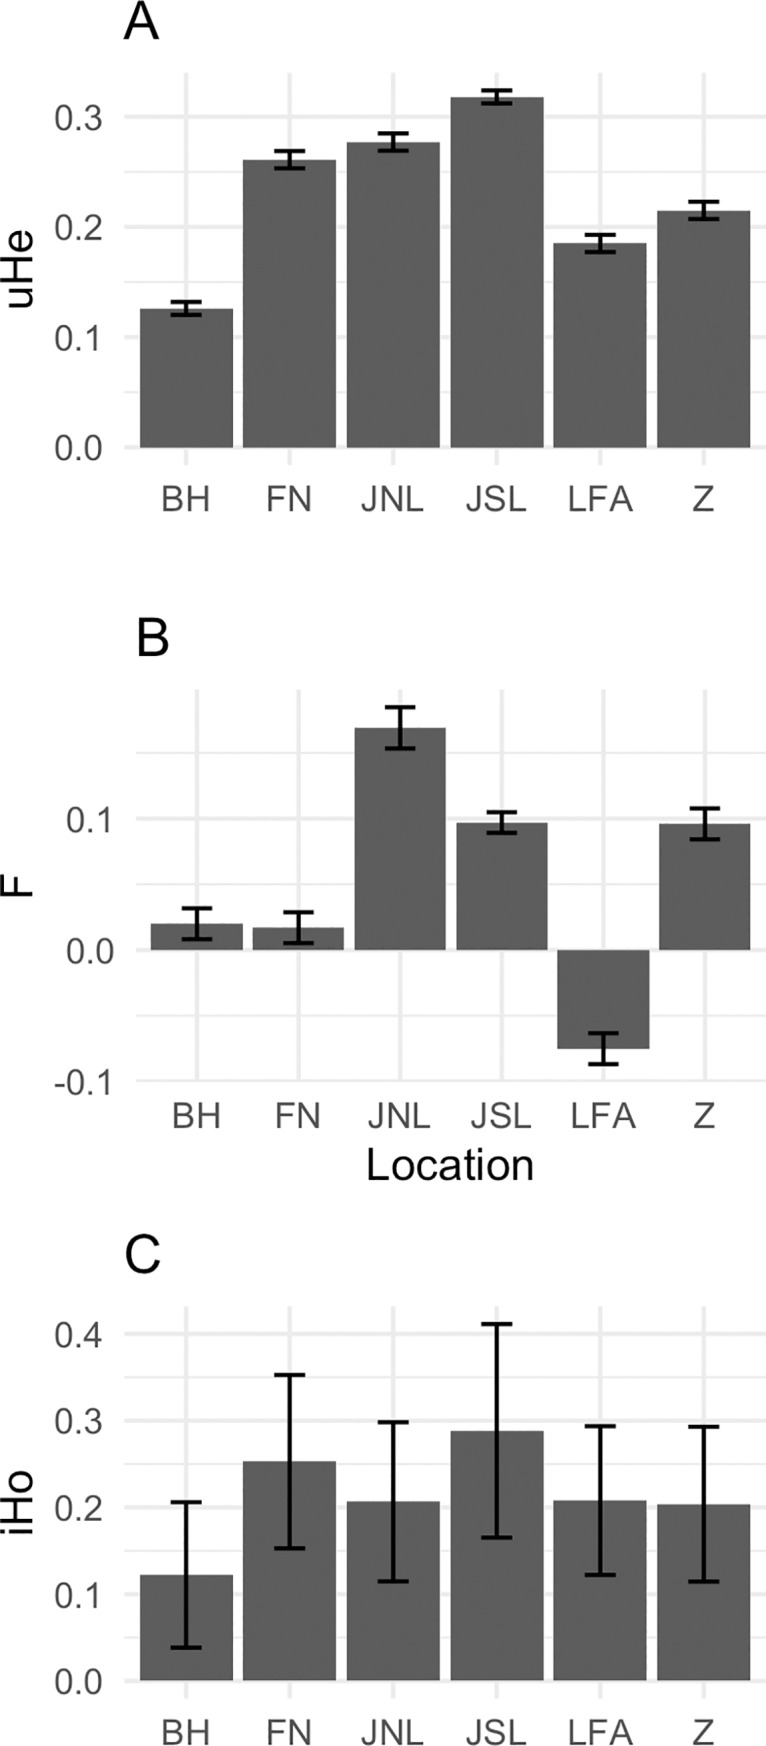
Fig 2. Plots of genetic heterozygosity and location.

Measures of (A) unbiased expected heterozygosity (uHE) and (B) F coefficient (FIS) and (C) individual observed heterozygosity (iHO), vary with location. Height of the bars indicate the estimated value and error bars represent the 95% confidence intervals of these estimates. Locations are as follows: BH = Bornholm, FN = Funen, JNL = Jutland north of the Limfjord, JSL = Jutland south of the Limfjord, LFA = Lolland and Falster and Z = Zealand.
