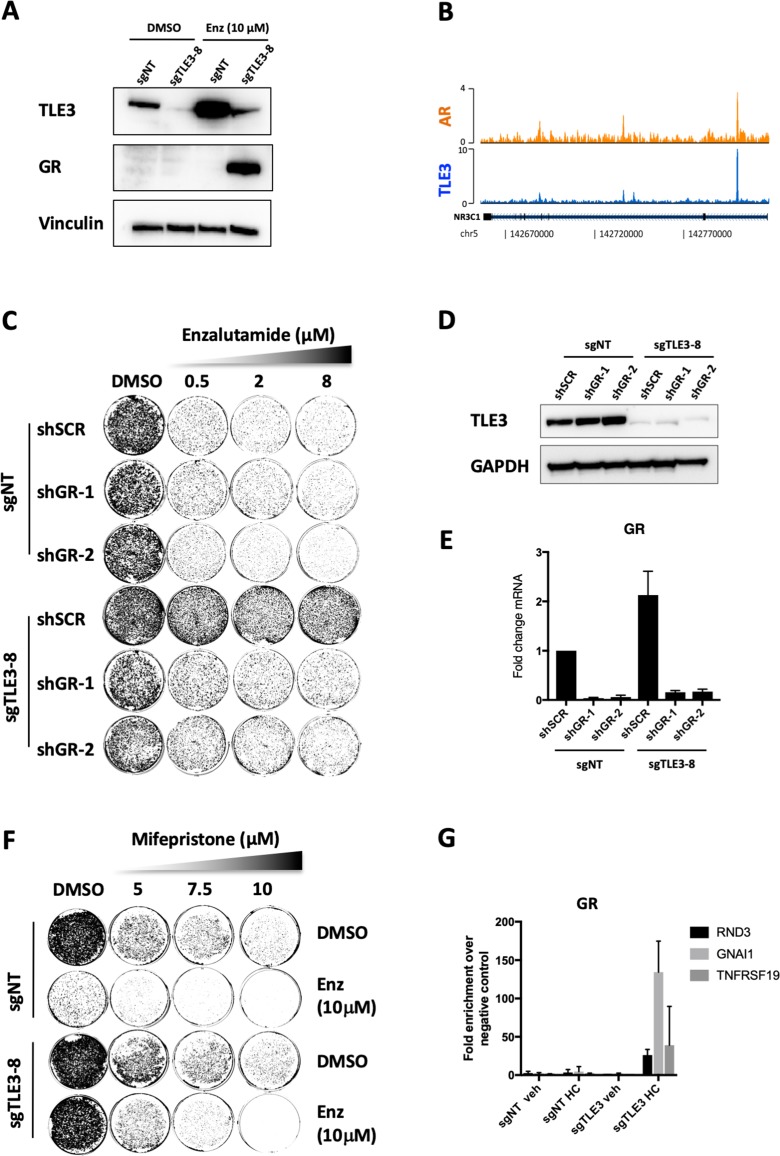
Figure 4. GR inhibition resensitizes TLE3KO cells to enzalutamide treatment.
(A) Western blot showing protein expression levels of TLE3 and GR in control and TLE3KO cells cultured vehicle or enzalutamide (B) Coverage profiles for TLE3 and AR binding at the GR locus. (C) Long-term growth assay (14 days) showing the drug resistance phenotype of control and TLE3KO cells with and without GR knockdown in the presence of vehicle or enzalutamide. (D) Western blot analysis for TLE3 protein levels in control and TLE3KO cells shown in C, using GAPDH as a loading control. (E) mRNA levels for GR in control and TLE3KO cells carrying shSCR or shGR constructs, shown in C. (F) Long-term growth assay (14 days) for cells harboring a control sgRNA or TLE3-targeting sgRNA cultured in the presence of vehicle, enzalutamide, mifepristone or the combination at indicated concentrations. (G) ChIP-qPCR showing GR occupancy at enhancers proximal to indicated genes. All samples were cultured in the presence of 10 μM enzalutamide with or without 1 μg/ml hydrocortisone (HC) as indicated.


