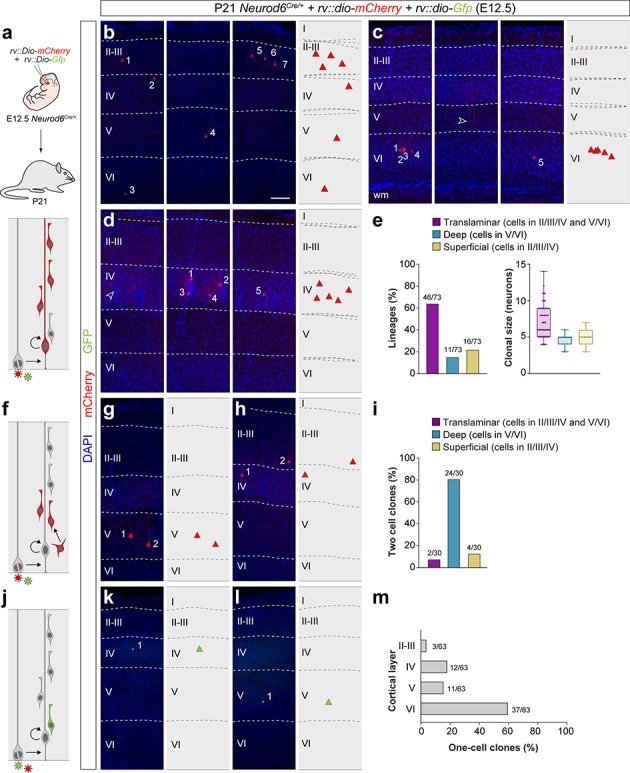
Figure 2. Retroviral-based lineage tracing reveals diverse lineage outcomes.
(a) Experimental paradigm. The bottom panel illustrates the expected labeling outcome following retroviral infection of an RGC undergoing a neurogenic cell division in which the viral integration occurs in the self-renewing RGC. (b–d) Serial 100 μm coronal sections through the cortex of P21 Neurod6Cre/+ mice infected with low-titer conditional reporter retroviruses at E12.5. The images show examples of translaminar (b), deep-layer restricted (c) and superficial-layer restricted (d) lineages containing three or more cells. Dashed lines define external brain boundaries and cortical layers. The schemas collapse lineages spanning across several sections into a single diagram. Example images illustrating each lineage correspond to sequential sections of the same brain. (e) Quantification of the fraction of translaminar, deep- and superficial-layer restricted lineages containing three or more cells, and clonal size. Boxes show median and inter-quartile distance, whiskers correspond to minimum and maximum values. Colored dots show individual clonal size values. (f) Expected labeling outcome following retroviral infection of an RGC undergoing a neurogenic cell division in which the viral integration occurs in an IPC (indirect neurogenesis). (g,h) Coronal sections through the cortex of P21 Neurod6Cre/+ mice infected with low-titer conditional reporter retroviruses at E12.5. The images show examples of superficial and deep layer-restricted two-cell clones. (i) Quantification of the fraction of translaminar, deep and superficial layer-restricted two-cell lineages. (j) Expected labeling outcome following retroviral infection of an RGC undergoing a neurogenic cell division in which the viral integration occurs in a postmitotic neuron (direct neurogenesis). (k,l) Coronal sections through the cortex of P21 Neurod6Cre/+mice infected with low-titer conditional reporter retroviruses at E12.5. The images show examples of superficial and deep layer-restricted single-cell clones. (m) Laminar distribution of single-cell clones. n = 166 lineages in seven animals. Scale bar equals 100 µm. Data used for quantitative analyses as well as the numerical data that are represented in graphs are available in Figure 2—source data 1 and Figure 1—source data 2. See also Figure 2—figure supplement 1.

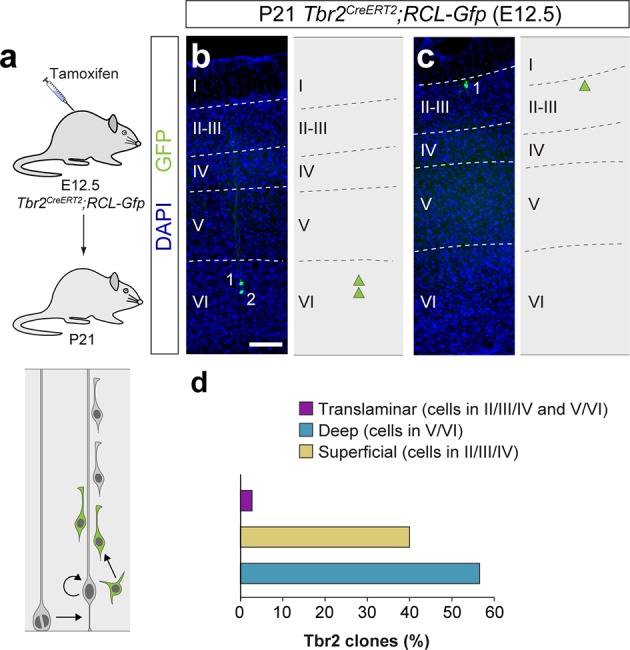
Figure 2—figure supplement 1. Lineage tracing of Tbr2+ intermediate progenitor cells.

