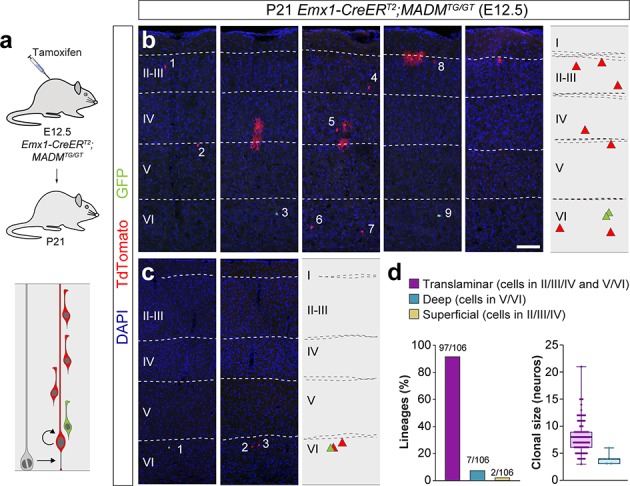
Figure 3. Lineage tracing using MADM identifies a small fraction of deep layer-restricted cortical lineages.
(a) Experimental paradigm. The bottom panel illustrates the expected labeling outcome of a neurogenic RGC division following inducible MADM-based lineage tracing in which two subclones are labeled with different reporters. (b,c) Serial 100 µm coronal sections through the cortex of P21 Emx1-CreERT2;MADMTG/GT mice treated with tamoxifen at E12.5. The images show examples of translaminar (b) and deep layer-restricted (c) lineages. The schemas collapse lineages spanning across several sections into a single diagram. Example images illustrating each lineage correspond to sequential sections of the same brain. (d) Quantification of the fraction of translaminar, deep and superficial layer-restricted lineages, and clonal size in MADM lineages derived from a neurogenic (asymmetric) RGC division. Boxes show median and inter-quartile distance, whiskers correspond to minimum and maximum values. Colored dots show individual clonal size values. n = 106 neurogenic lineages in 28 animals. Scale bar equals 100 µm. Data used for quantitative analyses as well as the numerical data that are represented in graphs are available in Figure 3—source data 1 and Figure 1—source data 2. See also Figure 3—figure supplement 1.

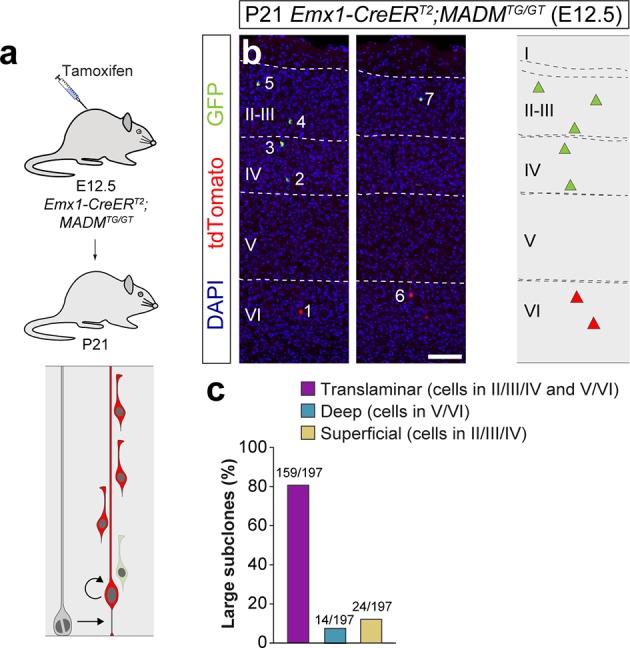
Figure 3—figure supplement 1. Large MADM subclones reveal a small fraction of artifactual superficial layer-restricted lineages in the retroviral experiments.

