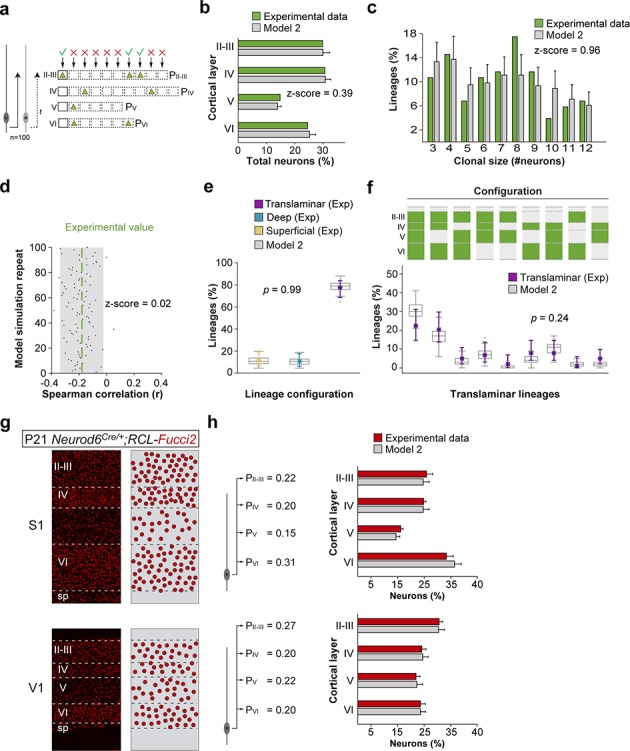
Figure 7. A small number of progenitor identities underlie lineage diversity.
(a) Schematic representation of a mathematical model of cortical neurogenesis in which two different progenitor identities are modeled (Model 2). Squares represent the maximum number of stochastic decisions performed by each progenitor for each cortical layer during in silico simulations. The odds of generating neurons for each chance are given by a probability value (P), which is unique for each layer and progenitor identity. The model runs 100 simulations with 100 progenitors. (b) Fraction of cells in each cortical layer (expressed as percentage of total) in experimental and modeled lineages. (c) Clonal size distribution in experimental and modeled lineages. (d) Spearman correlation (r) values for the fraction of superficial and deep layer neurons in modeled lineages. Each dot represents an r value for one simulation. The green line shows the experimental value; the shadow area around the experimental data represents a 95% confidence interval for the experimental value. (e) Fraction of translaminar, deep and superficial layer-restricted lineages found experimentally and predicted by the model (expressed as percentage of all modeled lineages within a single simulation). Gray boxes represent variability among 100 simulations; colored stars and lines show experimental values and 95% confidence intervals for experimental values (p=0.99, Fisher’s exact test). (f) Relative frequency (expressed as percentage over all modeled translaminar lineages within a single simulation) of laminar configurations in experimental and modeled translaminar lineages. Gray boxes represent variability among 100 simulations; colored stars and lines show experimental values and 95% confidence intervals for experimental values (p=0.24, Chi-square test). (g) 60 µm coronal sections through the primary somatosensory (S1) and visual (V1) cortex of P21 Neurod6Cre/+;RCL-Fucci2 mice. The schemas on the right illustrate PC densities per layer. (h) Fraction of PCs per layer (expressed as percentage of total neurons) generated with two sets of laminar probability factors using Model two compared to the experimental data. Histograms represent mean ± standard deviation. Z-scores represent the distance between experimental and simulated results for each parameter, which is calculated as the difference between the averages of model and experimental data divided by the standard deviation within model simulations (see Materials and methods for details). n = 103 neurogenic lineages in the primary somatosensory cortex of 25 animals. Data used for quantitative analyses as well as the numerical data that are represented in graphs are available in Figure 4—source data 1, Figure 7—source data 1 and Figure 1—source data 2. The code for the generation of lineages can be found in Figure 7—source code 1. See also Figure 7—figure supplement 1.

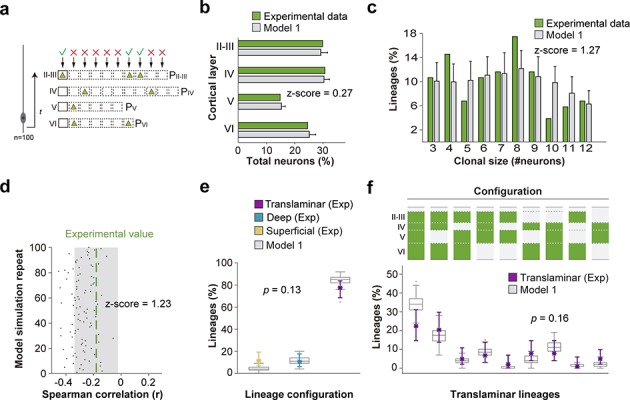
Figure 7—figure supplement 1. Stochastic models considering single and multiple programs corroborate Bayesian inference.

