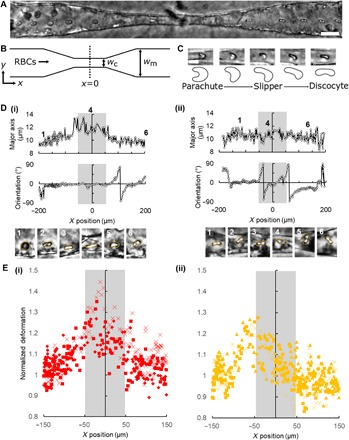
Fig. 2. Motion and deformation of RBCs while traversing capillary constriction zones.

(A) Superimposed time lapse image series of RBC motion through an endothelialized vessel. Time lapse interval: 0.1 s. Scale bar, 25 μm. (B) Schematic showing RBC perfusion through constriction-shaped vessel. wc = 10 μm; wm = 40 μm. (C) Representative examples of parachute-, slipper-, and discocyte-like RBC deformations in capillary constrictions. Scale bar, 10 μm. (D) Representative traces of RBC major axis length and orientation for (i) stretching and (ii) tumbling RBCs, where x = 0, y = 0 is the center of the capillary; gray boxes: capillary extents. (E) Normalized extent of deformation, defined as the ratio of major axis length at a given position to the average major axis length in the precapillary region for (i) normal RBCs and (ii) knobless malaria-IRBCs (n = 3; each biological replicate is represented by one symbol, ■, ♦, ×, or ▲).
