
Fig. 3. Population dynamics analysis of RBC flow and accumulation within constriction capillaries.
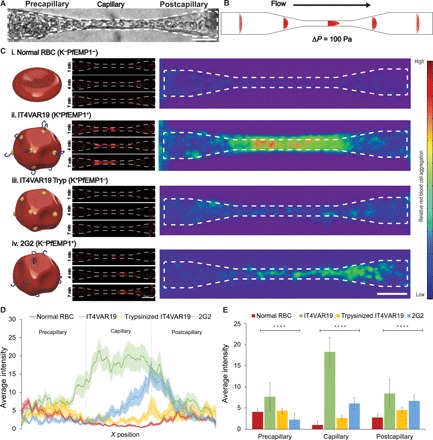
(A) Bright-field image of RBCs flowing through a constriction vessel. Dotted lines demonstrate capillary outline trace. (B) Flow velocity model of a single capillary based on fabrication dimensions. (C) Left: Schematic illustrations of the different types of perfused RBCs and IRBCs. Middle: Representative image of binding kinetics within the capillary constriction zones. IRBCs are shown in red. Right: Spatial distribution of accumulation after 20 min of perfusion represented by a combined heat map of average fluorescence from multiple experiments. Normal RBC (n = 24), IT4VAR19 (n = 26), trypsinized IT4VAR19 (n = 19), and 2G2 (n = 19). (D and E) Quantification of average intensity as a measure of x position (D) and comparison among precapillary, capillary, and postcapillary regions (E). n = 24, 26, 17, and 19 ACV units quantified from N = 4 independent experiments for each condition of perfusion: normal RBC, IT4VAR19, trypsinized IT4VAR19, and 2G2, respectively. Analysis of variance (ANOVA) F = 11.61, P < 0.00001 for precapillary region, ANOVA F = 47.83, P < 0.00001 for capillary region, and ANOVA F = 6.41, P < 0.001 for postcapillary region.