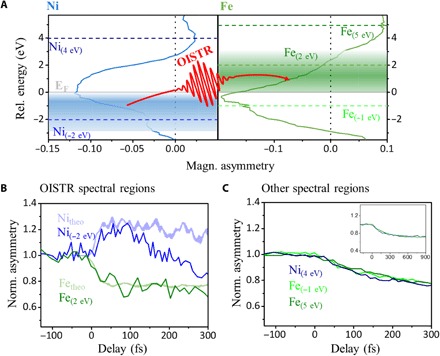
Fig. 3. Direct time-resolved verification of the OISTR effect on ultrashort time scales.

(A) Static magnetic asymmetry of Fe and Ni plotted as a function of the energy relative to the Fermi level, i.e., the measured photon energy after subtracting the M3 core level energy. (B and C) Spectral dynamics of the magnetic asymmetry of Fe and Ni for different spectral regions. (B) In the energy regions marked in (A) by the shaded colored bars according to the calculations shown in Fig. 1, the spin dynamics show a clear fingerprint of OISTR, on ≈50-fs time scales. (C) In contrast, other spectral regions display only the conventional demagnetization caused by multistep relaxation processes. The inset shows the demagnetization dynamics on a longer time scale, revealing a quenching level of ~25% to which all spectral regions converge. Note that the integrated signals averaging over extended spectral regions show the typical delayed behavior between Fe and Ni (see the Supplementary Materials), as seen before (34). The characteristic energies that are analyzed are marked in (A) with the dashed lines.
