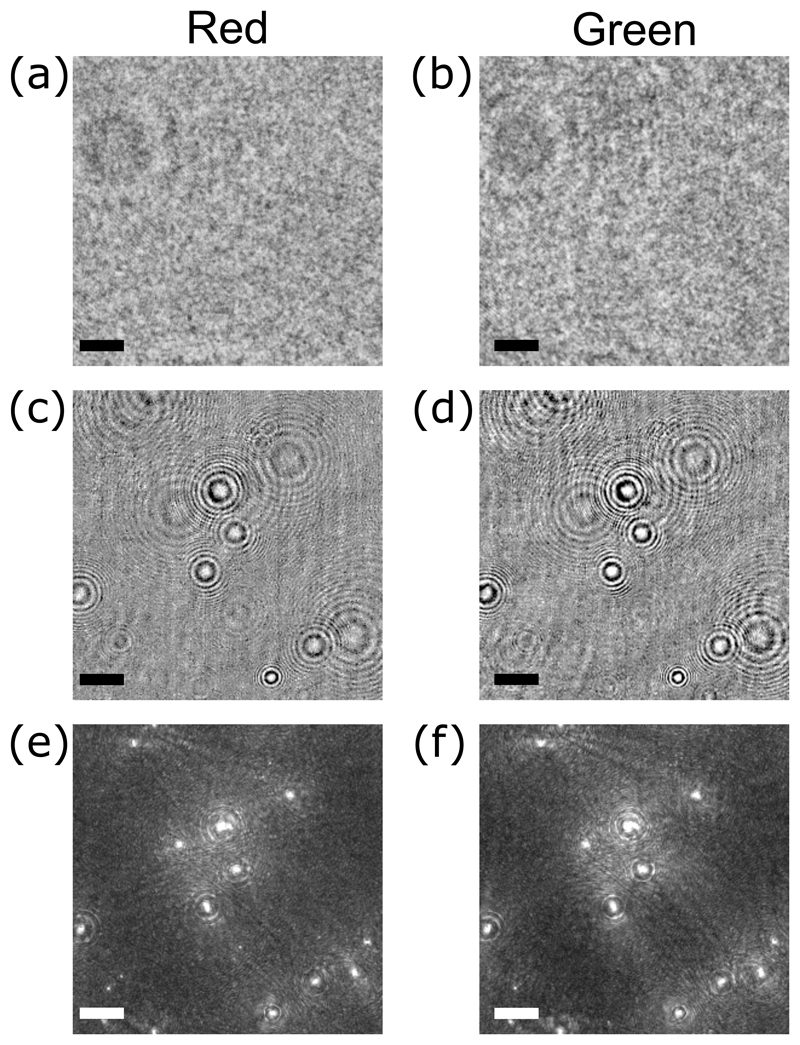
Fig. 2.
Example two-color holographic images of a mixture of E. coli cells and polystyrene beads (see text), showing intermediate processing steps. Panels (a) and (b) show raw holographic data. The images in panels (c) and (d) show the same data, but with the static background removed (see text). The bottom row shows the maximum intensity projection of the intensity gradient stacks Igrad (x, y, z; t); this data can be used either for image registration or for object localization. The scale bars represent 25 μm in all panels.

