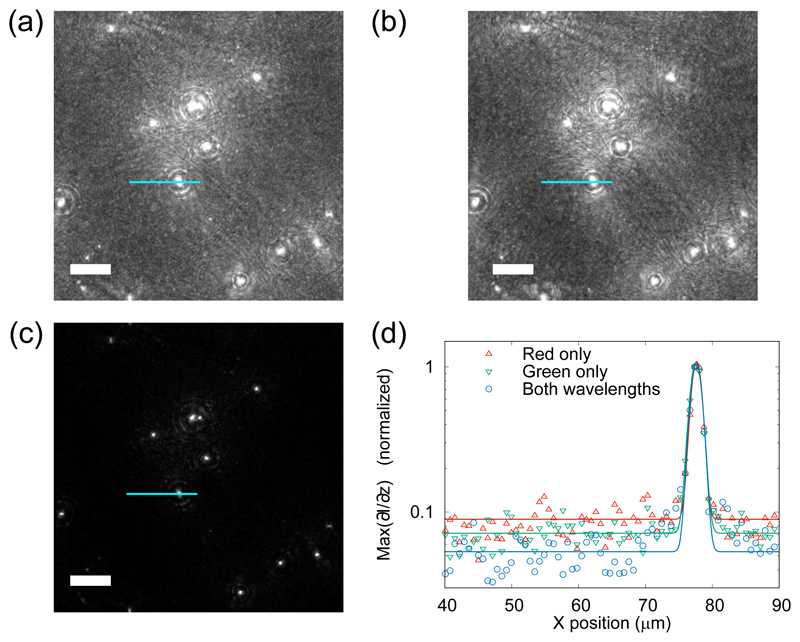
Fig. 4.
Signal-to-noise ratio improvements using two-color DHM on a mixture of E. coli cells and polystyrene beads. Panels (a) and (b) show maximum intensity projections of gradient stacks from the red and green channels, respectively. Panel (c) shows the effect of multiplying the channels together. Panels (a–c) are displayed using a linear mapping from black for the minimum value, to white for the maximum value. Panel (d) shows a line profile along the path indicated with a light blue line in panels (a–c). The data in panel (d) have been scaled to have a maximum of 1, and fitted with a Gaussian curve (see text), to demonstrate improvements in the SNR. The scale bars in panels (a–c) represent 25 μm.

