Fig. 5.
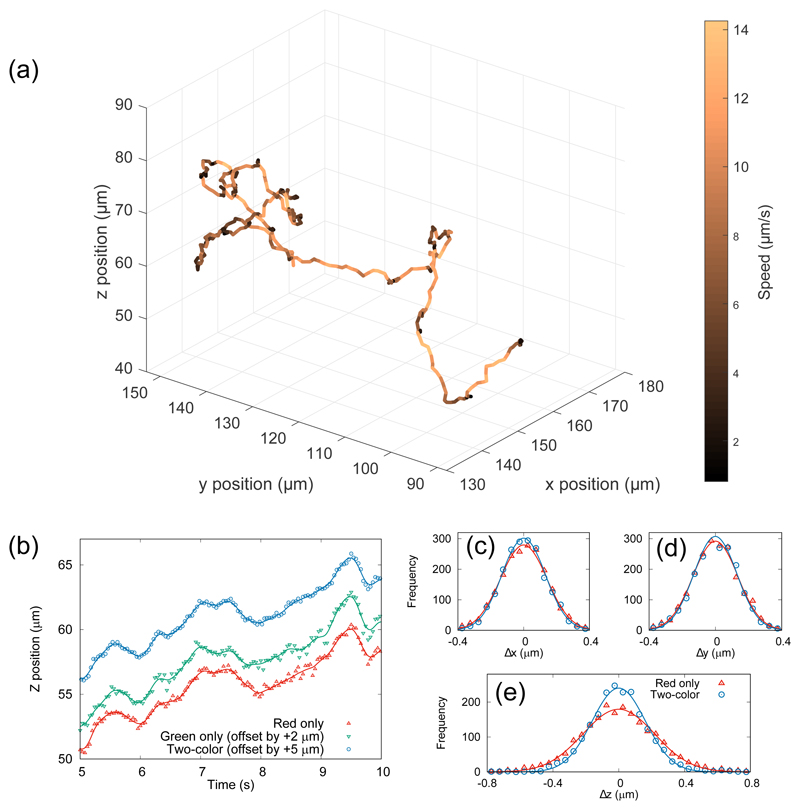
(a) A three-dimensional reconstruction of the swimming trajectory of bacterial cell, color-coded with instantaneous swimming speed. The total track duration is 40 seconds. (b) Five seconds of data showing the z-position as a function of time from the red channel only (bottom), the green channel only (middle, offset by 2 μm) and using both channels combined (top, offset by 5 μm). The black lines through the data points show the spline-smoothed track used to characterize the localization noise (see text). (c–e) Histograms of residuals when a spline fit is removed from the three-dimensional trajectory shown in (a). The one- and two-color systems achieve similar accuracy in the plane normal to the optical axis (Δx and Δy), but the two-color method reduces uncertainty in the axial coordinate (Δz), shown by the narrower histogram in panel (e).

