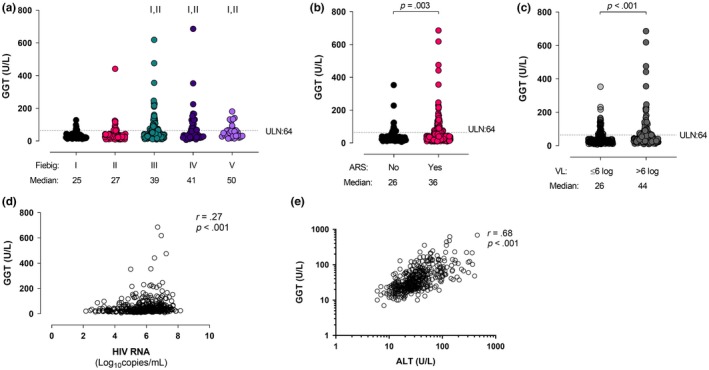
Figure 4.

(a) GGT levels stratified by Fiebig stage at diagnosis. (b) GGT levels stratified by the presence or absence of acute retroviral syndrome at diagnosis. (c) GGT levels stratified by HIV plasma RNA level at diagnosis. (d) GGT correlates with HIV RNA at baseline. (e) GGT correlates with ALT at baseline. I indicates statistically significant compared with Fiebig I, II indicates statistically significant compared with Fiebig II.
