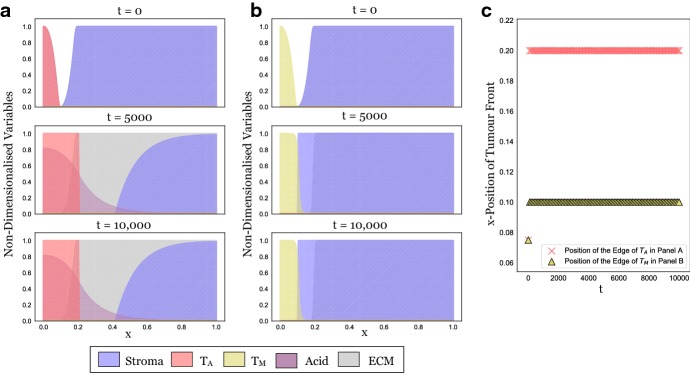
Fig. 3.
In isolation, the tumour populations fail to invade. a Snapshots at three time points from a long-term simulation (, corresponding to more than 10 years) in which only is present. Expansion stalls because of obstruction by the matrix. b Analogous simulation of the dynamics with in isolation. This time the tumour cannot overcome the stroma. c Plot showing the position of the tumour edge in Panels A and B over time, determined as for , respectively. We conclude that the model and the numerical scheme behave as expected and that any invasion seen later in this paper is due to the interaction between the two cell types (Colour figure online)

