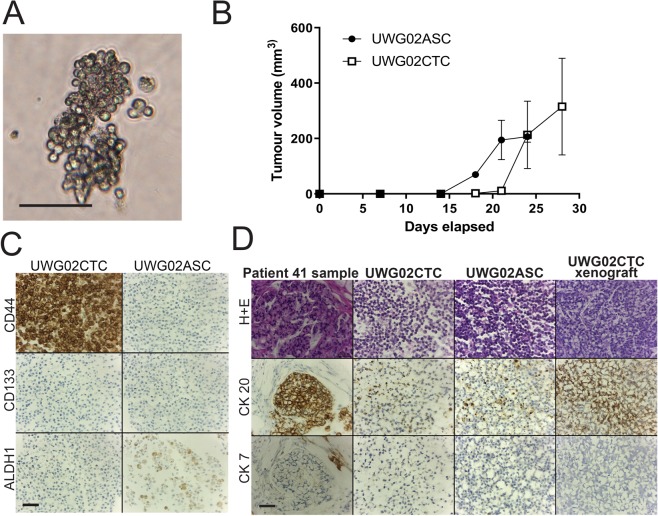
Figure 2.
Characteristics of patient 41 tumour, UWG02CTC and UWG02ASC cell lines. (A) Representative images of the loose aggregates formed by UWG02CTC. Scale bar 50 µm. (B) Both UWG02CTC (n = 3, open squares) and UWG02ASC (n = 2, solid dots) rapidly formed tumours in immunocompromised mice, with all mice reaching tumour endpoints within 4 weeks. (C) Expression of cancer stem cell markers in UWG02CTC and UWG02ASC. Scale bar 100 µm. (D) IHC analyses of primary tumour, UWG02CTC and UWG02ASC. Both cell lines showed strong CK-20 and weak CK-7 staining, with an identical expression profile in tumours formed in the mouse xenograft. Scale bar 100 µm.

