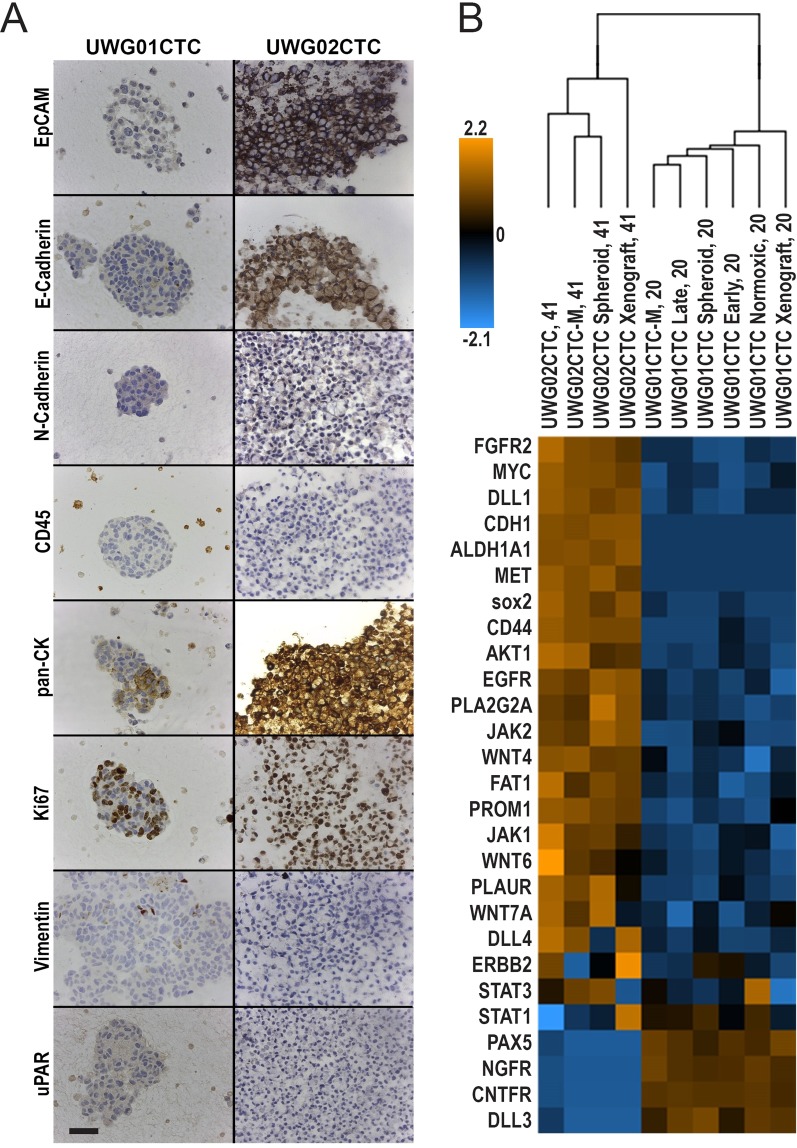
Figure 3.
Comparison of UWG02CTC versus UWG01CTC. (A) Immunohistochemical analysis of the expression of key proteins. The distinct phenotypes of the two CTC cell lines are highlighted in this figure; UWG02CTC expresses epithelial markers (EpCAM and E-Cadherin) as well as strong cytokeratin staining. In contrast UWG01CTC has no epithelial staining and weak/patchy cytokeratin staining. Both cell lines show high Ki67 expression supporting a high proliferation rate. No CD45 staining was seen in any of the cell lines. Scale bar 100 µm. (B) Heat-map (unsupervised hierarchical clustering) of selected gene expression profiling of CTC cultures (UWG01CTC versus UWG02CTC) with matching mouse xenografts. Count data has undergone z-score transformation to give equal mean and variance across the samples. Orange indicates a higher score, blue indicates a lower score.

