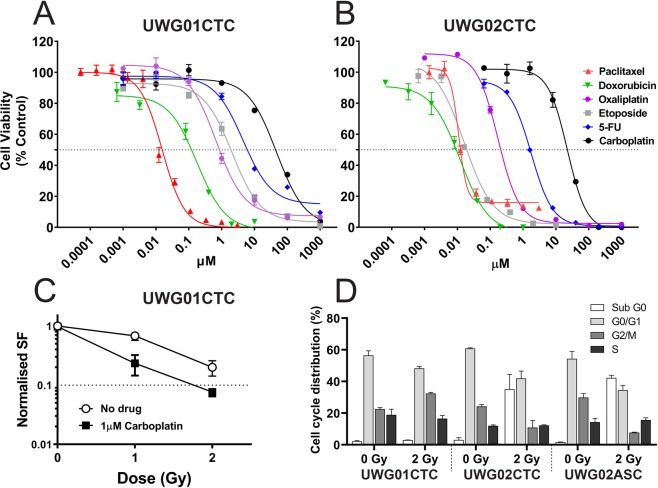
Figure 4.
Drug responsiveness of CTC cell lines. Representative dose response curves for cytotoxic agents against (A) UWG01CTC and (B) UWG02CTC. All analyses were performed in hypoxic conditions. Cell viability of treated cells was normalised against vehicle controls, and presented as mean ± SEM (n = 3). 50% viability for IC50 is indicated by the grey dotted line. (C) Cell survival of UWG01CTC determined by clonogenic assay. Cells were irradiated with or without carboplatin (1 μM). Surviving fractions of irradiated cells only (no drug) and drug only were normalized to unirradiated non drug treated control. Each data point represents the means ± SEM of at least two independent experiments. (D) Comparison of cell cycle distribution for each cell line following radiotherapy. Each cell line has been normalised to the matched untreated control.

