Fig. 2.

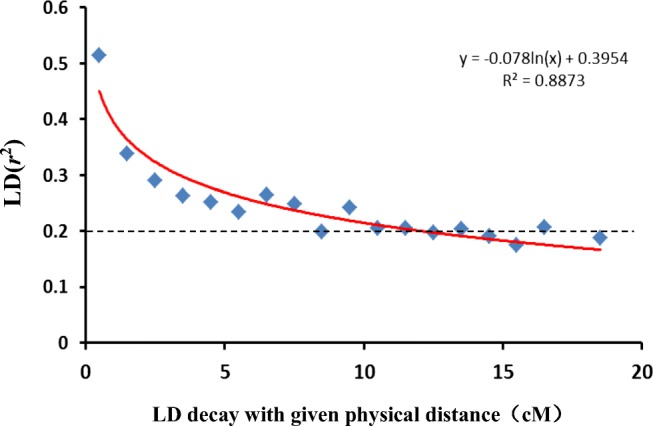
LD (r2) decay plot of marker pairs on all seven chromosomes as a function of genetic distance (in cM) for the 120 wheat accessions. The curve illustrates LD decay based on the nonlinear regression of r2 on genetic distance

LD (r2) decay plot of marker pairs on all seven chromosomes as a function of genetic distance (in cM) for the 120 wheat accessions. The curve illustrates LD decay based on the nonlinear regression of r2 on genetic distance