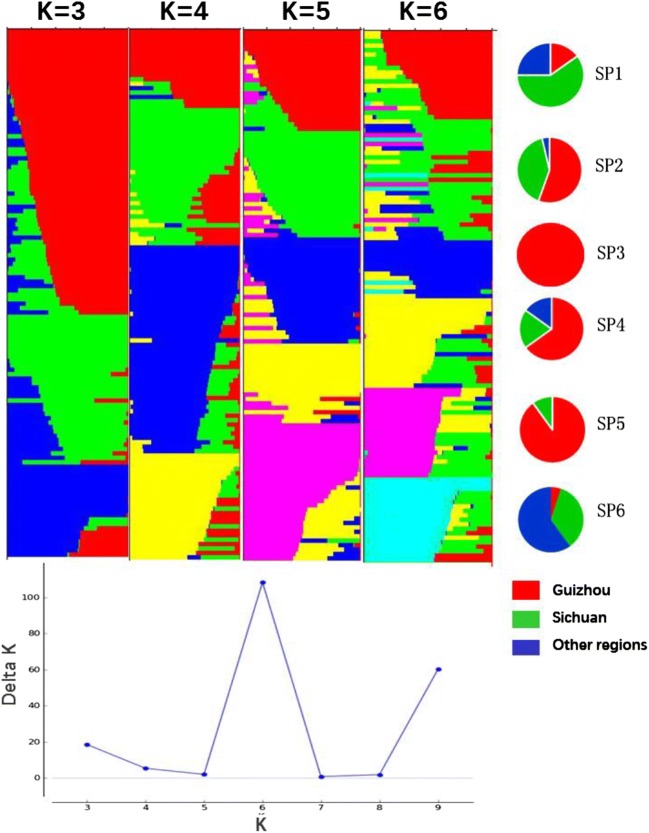
Fig. 3.
The population structure of 120 wheat accessions. Delta K is the function of k from the structure run, and the plateau at k = 6 indicates the number of sub-populations in our collection, clustering of wheat set genotypes into six sub-groups (SP1, SP2, SP3, SP4, SP5, and SP6). Six pie charts represent the proportion of varieties from different regions; red indicates Guizhou wheat varieties, green indicates Sichun’s, and blue indicates those in other regions

