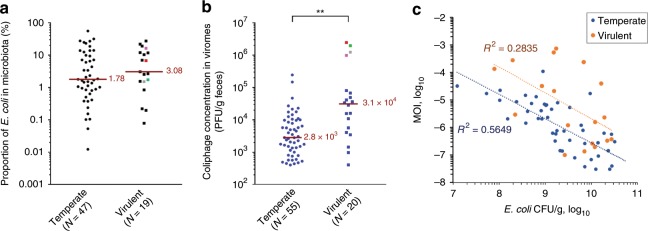
Fig. 2. E.coli and coliphage levels in microbiota, segregated by phage lifestyle.
a A slight increase of the fraction of E. coli to total microbiota OTU is found among samples containing virulent coliphages, compared to those where temperate phages were found (not statistically significant, Mann–Whitney test, P = 0.39). b The overall coliphages titer in the fecal sample is significantly higher for virulent, compared to temperate phages (**, P = 0.0002). In both first panels, red line = median value, four colored points = top coliphages titers. c The multiplicity of infection (MOI) correlates negatively with E. coli concentration in the fecal samples, both for virulent and temperate phage containing samples (R2, coefficient of determination of the power law). Source data are provided as a Source Data file.

