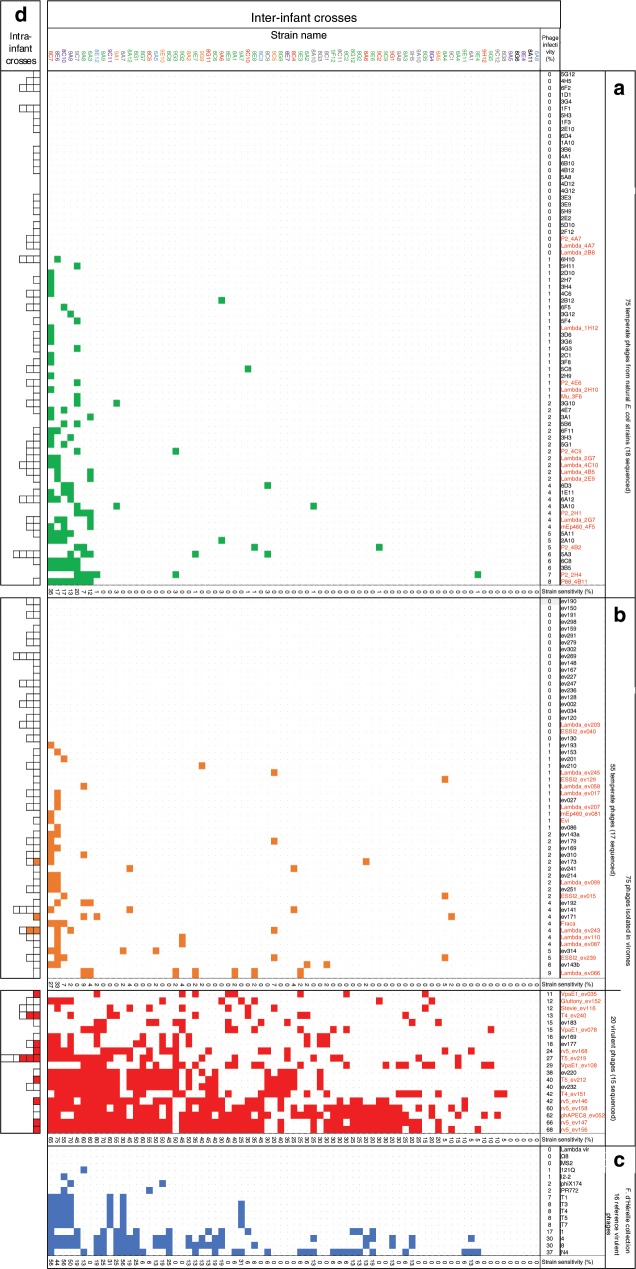
Fig. 3. Phage impact on natural E. coli strains.
Bacterial lawns of 75 E. coli isolates from infant fecal samples were infected with 166 coliphage spots. The left column shows strain names with color-coded phylogroups: A in blue, B1 in red, B2 in green, C in purple, D in orange, E in gray and unclassified Escherichia clades in black. Upper row: phage names, split into 3 categories (panels (a)–(c)). Each square of the matrix corresponds to a phage–strain interaction (white: no phage growth, color: phage growth, green, temperate isolated from a lysogen, orange, temperate isolated from a virome, red, virulent isolated from virome, blue, virulent from d’Hérelle collection). In panels (a), (b), all crosses are inter-infant (i.e. phage and strain never come from the same infant). The “phage infectivity” line sums up the percentage of strains killed by each phage. The “strain sensitivity” column sums up the percentage of phages in each category infecting this strain. a 75 temperate phages derived from fecal E. coli strains supernatants, either as crude lysates (57 of them, black entry) or as plaque purified and amplified on an indicator strain (18, in red, completely sequenced). b 75 coliphages found in viromes, plaque purified and amplified on an indicator strain. To determine the temperate or virulent phenotype, see text. The genome of phages labeled in red were completely sequenced. c 16 reference virulent coliphages obtained from the Felix d’Hérelle Reference Center for Bacterial Viruses (www.phage.ulaval.ca). d Intra-infant crosses (infant coliphages tested on the strains originating from the same fecal sample). For phages in panel (a), the E. coli strain from which the phage was collected is excluded.

