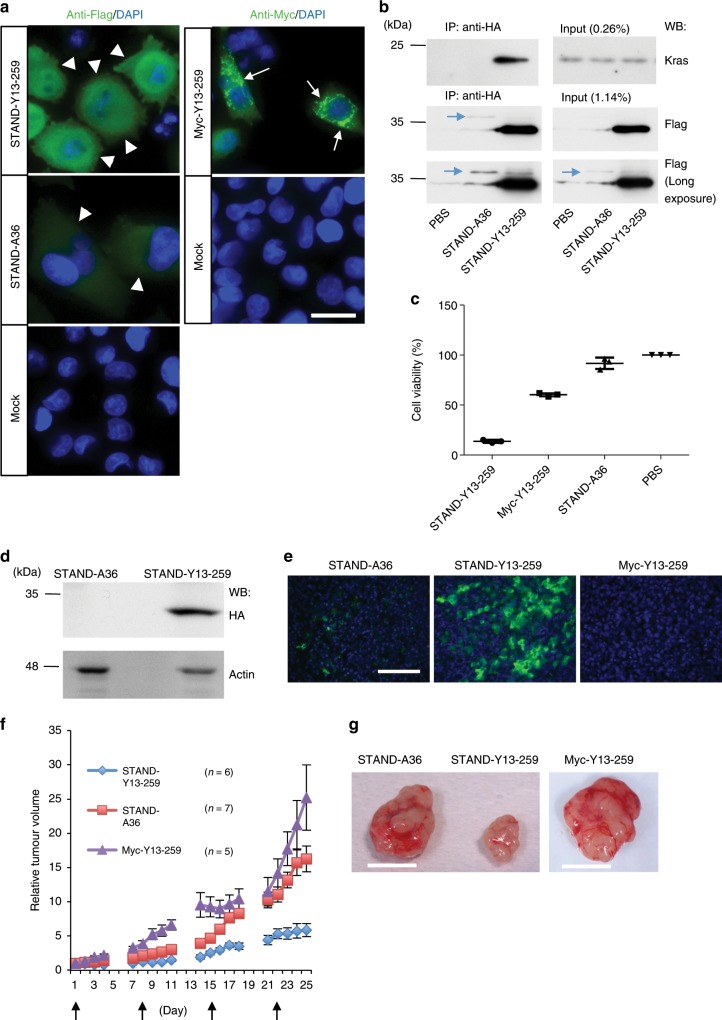
Fig. 10. Tumour growth inhibition by STAND-Y13-259 in vivo.
a Immunocytochemical analysis of MIA PaCa-2 cells 4 days after infection with Lenti-STAND-Y13-259, Lenti-Myc-Y13-259, and Lenti-STAND-A36 (green; anti-Flag to detect scFv; blue, Hoechst staining to detect nuclei). Arrowheads indicate STAND-Y13-259 and STAND-A36 stably expressed in the cytoplasm. Arrows indicate Myc-Y13-259 aggregates. b Intracellular interaction of endogenous Kras and STAND-Y13-259 in MIA PaCa-2 cells infected with lentiviral vectors. Immunoprecipitates with anti-HA antibody were analysed using western blotting (WB) with indicated antibodies. Expression of STAND-A36 was weak compared to that of STAND-Y13-259 (arrows in middle and bottom panels). c Viability of MIA PaCa-2 cells infected with indicated lentiviral vectors, as determined using an MTS assay after 4 days (n = 3 independent samples). Statistical analysis: two-tailed one-way analysis of variance, F (3, 8) = 490.4608, P < 0.00001, Tukey’s multiple comparison test, STAND-Y13-259 vs. Myc-Y13-25, P < 0.00001; STAND-Y13-259 vs. STAND-A36, P < 0.00001; STAND-Y13-259 vs. phosphate-buffered saline (PBS), P < 0.00001; Myc-Y13-259 vs. PBS, P < 0.00001; STAND-A36 vs. PBS, P = 0.0641. d Western blotting using a tumour of a subcutaneous heterotopic xenograft model of pancreatic cancer. Pre-established tumours were injected once weekly for 4 weeks at 2 sites with lentiviral vectors. Western blot analysis of STAND-Y13-259 (upper panel) and actin (lower panel) expression in tumours dissected from mice 3 days after the fourth lentiviral vector injection. e Immunohistochemistry of STAND-Y13-259 (upper panel), STAND-A36 (middle), and Myc-Y13-259 (lower panel) in the tumour described in d. f Tumour growth as described in d. Arrows indicate the day of lentivirus injection. Statistical analysis: Kruskal–Wallis test, P = 0.0005310, Dann’s post-hoc multiple comparisons test (STAND-Y13-259: n = 6, Myc-Y13-259: n = 5, STAND-A36: n = 7, STAND-Y13-259 vs. Myc-Y13-259, P = 0.0052; Myc-Y13-259 vs. STAND-A36, P > 0.9999; STAND-Y13-259 vs. STAND-A36, P = 0.0269). g Representative digital photographs of tumour xenografts dissected from mice 24 days after the first intratumoural injection with indicated lentiviral vectors. Scale bars, 25 μm a, 100 μm e and 10 mm g. Error bars represent standard error of the mean. Source data are provided as a Source Data file.

