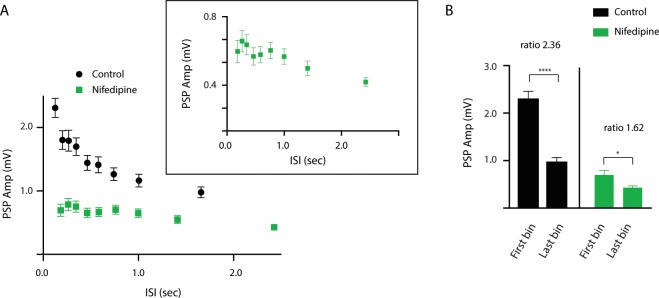
Figure 5.
Effect of nifedipine on synaptic transmission. (A) Scatter plot of ISI vs. PSP amplitude under control conditions (normal ASW) (black circles) and in the presence of 10 μM nifedipine (green squares). Inset, the data shown in the main part of the figure plotted with a different scaling. Note that facilitation is observed under both conditions, but the facilitation observed in the presence of nifedipine is much less than the facilitation observed under control conditions. (B) Bar graphs plotting PSP amplitude at a short ISI (first bin of pooled data) vs. a long ISI (last bin) under control conditions (normal ASW) (black) and in the presence of 10 μM nifedipine (green). Note that the PSPfirst bin/PSPlast bin ratio in nifedipine was much less than the PSPfirst bin/PSPlast bin ratio under control conditions (i.e., 2.36 vs. 1.62). In all cases data are plotted as means ± SEMs.

