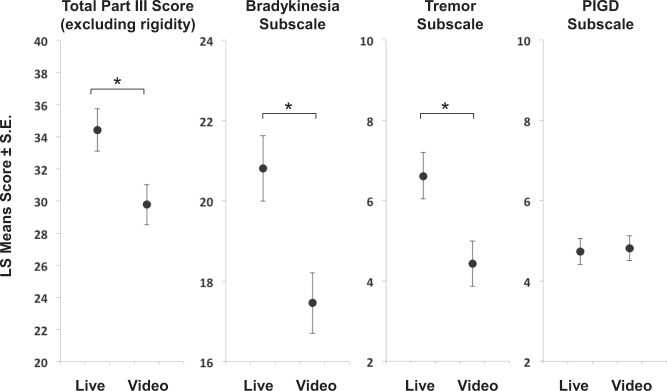
Fig. 3. MDS-UPDRS Part III scores, by subscale.
The protocol for studies 2, 3, and 4 each included multiple administrations of part III of the MDS-UPDRS. We pooled scores from live raters and video raters across all participants, all sessions, and all three studies of people with PD (N = 754 scores) and fit a mixed effects model with relevant demographic, clinical, and experimental variables. When applying this model to the total score (excluding rigidity items), significant main effects of rating context (whether the rating had been performed live or by video) were observed where the video ratings underestimated the score. Post hoc least squares means estimates of the total MDS-UPDRS part III score from video raters was significantly lower than that from live raters by 4.64 ± 0.64 points (left plot, t = 7.3, p < 0.0001) averaged across session condition and gender. The right three plots show the result of fitting subscale scores for tremor, bradykinesia, and PIGD for the same data set (N = 754) using the same mixed model. Post hoc least squares means estimates of the bradykinesia and tremor subscales from video raters were significantly lower than those of live raters (by 3.35 ± 0.45 points, t = 7.5, p < 0.0001, and 2.18 ± 0.23 points (t = 7.5, p < 0.0001, respectively). Post hoc least squares means estimates for PIGD from video raters, however, were not significantly different than those from live raters (−0.0878 ± 0.13 points, t = −0.675, p = 0.5002).

